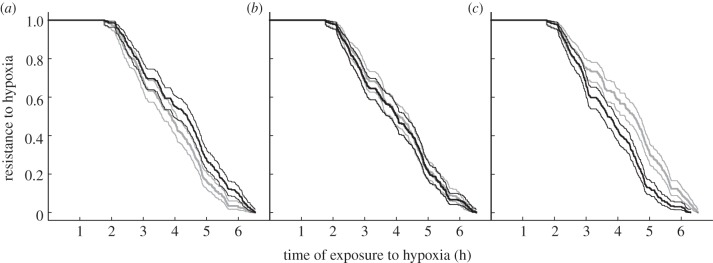
Figure 2.

Resistance of juvenile sole to hypoxia according to experimental treatment. Thick lines represent the percentage of individuals that resisted hypoxia up to the time point considered (also called the Kaplan–Meier estimator in survival analysis) and thin lines represent the associated 95% confidence intervals. (a) effect of larval rearing temperature (16°C (grey) or 20°C (black)); (b) effect of larval feeding regime (plain or enriched Artemia, A (grey) or AE (black)); (c) effect of juvenile dietary lipid content (11% (grey) or 20% (black)).
