
Figure 2.
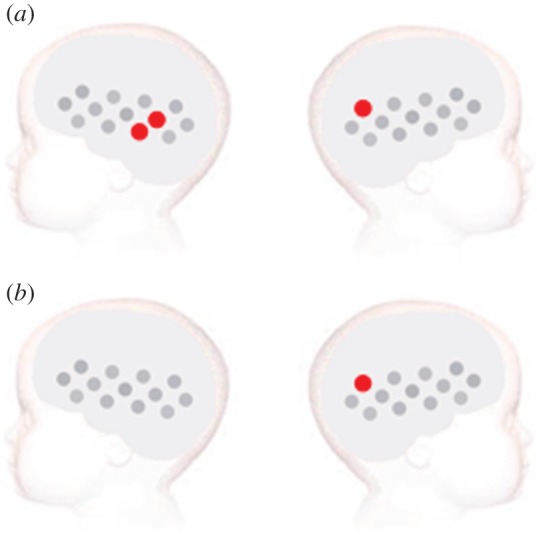
Visual social versus non-social stimuli analysis for the (a) low-risk and (b) high-risk infants. The statistically significant effects (two-tailed, p < 0.05) for the analysis of the visual social condition (no auditory stimulation) versus non-social baseline are presented on a diagram of the infant head. The channels that revealed a significant response during the specified time window of activation are plotted in red (increase in HbO2 concentration). Channels are plotted following the same layout as in figure 1.