
Figure 2.
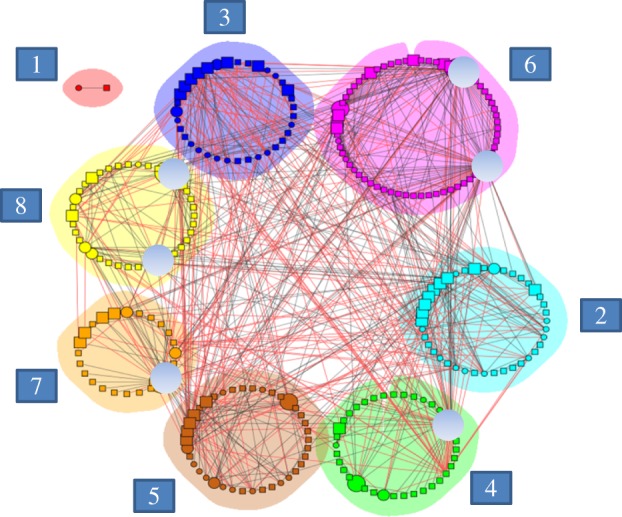
Modules (in different colours) in the network of 60 plants and their 220 pollinators. Size of a node (species) depicts the different network roles, from peripherals (smallest) to network hubs (largest, indicated in grey circles). Plant species are represented by circles and animals by squares (species identities given in the electronic supplementary material, appendix S3). Links of alien species are indicated in red, whereas those of the remaining species are in black (native, endemic or of unknown origin). Alien links represent 34 per cent of all links among modules. Numbers in squares refer to the module number given in the text.