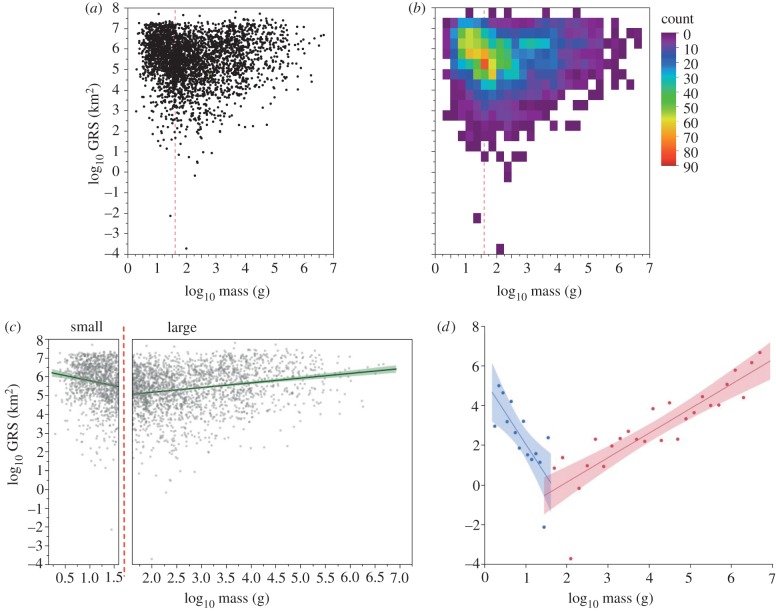
Figure 2.
Empirical relationship between body size and GRS in mammals. (a) Scatterplot of GRS versus mass. (b) Density plot of GRS versus mass. (c) Relationship between GRS and mass on either side of the modal mass. Lines are lines-of-best-fit from ordinary least-squares regression with 95% CIs about the fit. (d) The minimum observed GRS in body size classes on either side of the mode. Small mammals (less than 40 g) are in blue. Large mammals (more than 40 g) are in red. Points along the x-axis are plotted at the midpoint of each respective body size class. Dotted red lines in (a–c) indicate the modal mass for all mammals.

