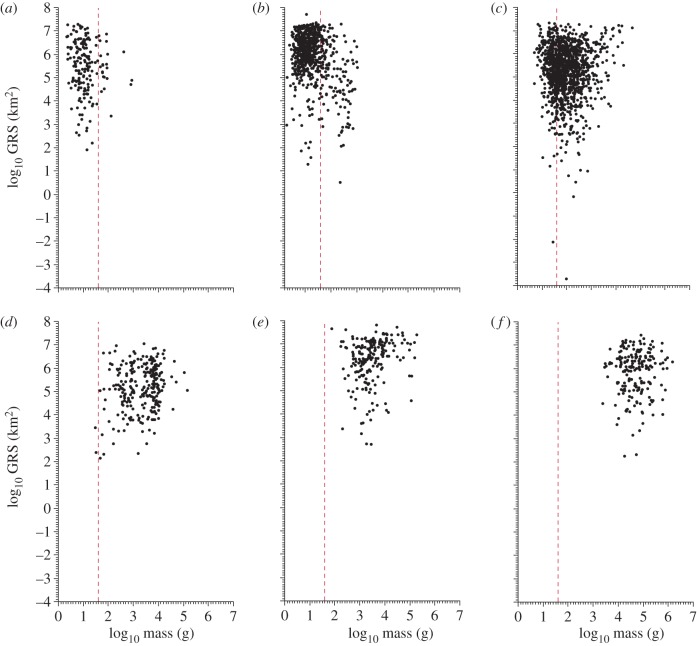
Figure 3.
Relationship between body size and GRS in different mammal Orders. Note the mean clade-specific mass increases from left to right. Dotted red lines indicate the modal mass for all mammals. (a) Soricomorpha, n = 175, r = –0.11; (b) Chiroptera, n = 683, r = –0.33*; (c) Rodentia, n = 1287, r = 0.02; (d) Primates, n = 259, r = 0.22*; (e) Carnivora, n = 210, r = 0.21*; (f) Artiodactyla, n = 196, r = 0.03. Significant correlations are indicated by an asterisk.

