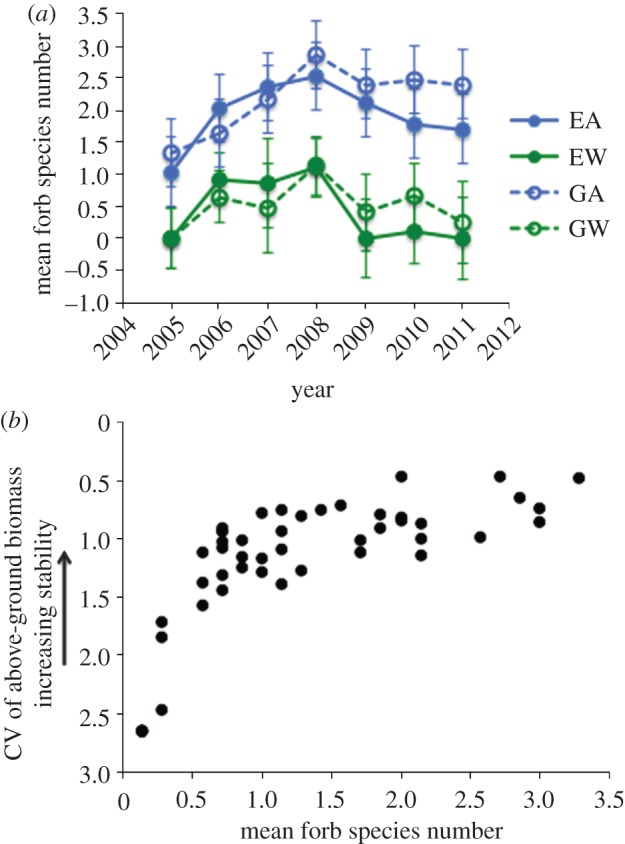
Figure 2.

(a) Inter-annual dynamics of forb richness (number of forb species per 0.25 m2 plot), shown as GLM-derived treatment means (±1 s.e.) for each year. Blue symbols and lines represent ambient means; green symbols and lines represent warmed means, whereas open symbols represent grazed means and closed symbols represent exclosed means. EA, exclosed, ambient; EW, exclosed, warmed; GA, grazed, ambient; GW, grazed, warmed. (b) Relationship between stability, defined as the inverse of the coefficient of variation (CV) of peak biomass indexed by point-frame pin hits per 0.25 m2 plot across the past 7 years of the experiment, and diversity (number of forb species per 0.25 m2 plot) within the forb component of the community, from 2005 to 2011. Because analyses were performed on the CV of biomass, indexed by point-frame sampling, rather than on the inverse of the CV, the y-axis is reversed to illustrate increasing stability (i.e. smaller CV values) upwards along the axis.
