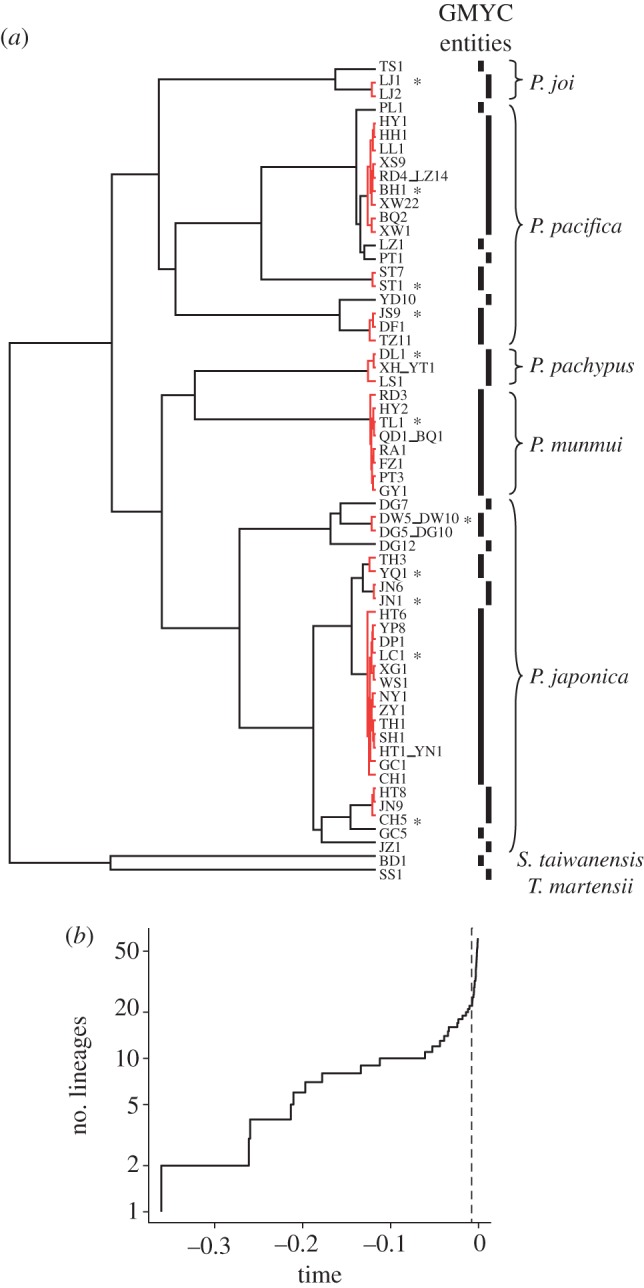
Figure 3.

Results of single-threshold GMYC analysis of a COI ultrametric tree. (a) Interspecific entities delimitated. In distinct clusters, red clades indicate intraspecific branching and asterisks indicate samples selected for subsequent divergence time analysis. Right vertical bars show interspecific branching. (b) Lineages-through-time plot. The vertical dashed line indicates the likelihood transition from interspecific diversification to coalescent lineage branching events. (Online version in colour.)
