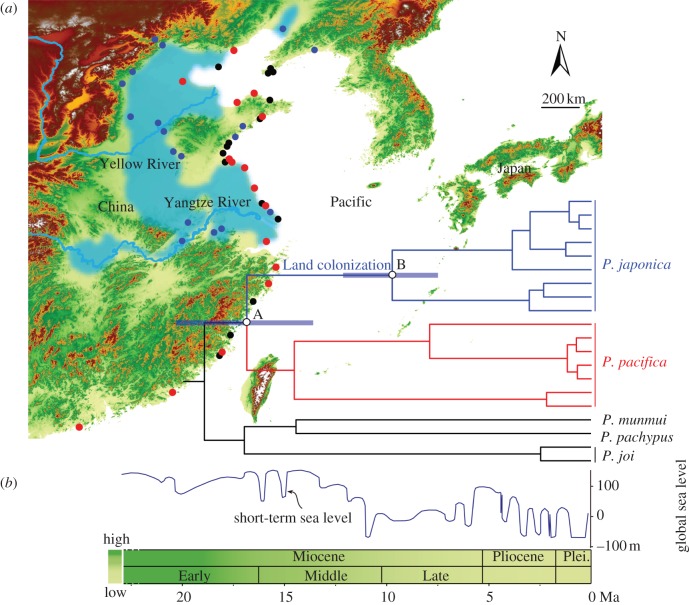
Figure 4.
Marine incursion scenario for the origin of terrestrial Platorchestia talitrids in continental East Asia. (a) Map of the Northwest Pacific showing sampling sites. Blue dots denote the terrestrial species P. japonica, red dots denote its sister species P. pacifica and black dots denote additional Platorchestia coastal species. Blue-shaded areas illustrate regions with marine ecosystems or regions into which episodic marine incursions occurred during the Miocene in East Asia (reconstructed from [7,21]). (b) Chronogram obtained using a relaxed clock model. The complete phylogeny is shown in figure 2. Purple bars indicate estimated standard deviations on selected nodes. Node A represents the divergence between terrestrial talitrids and their closest coastal relative, and node B represents the initial divergence within the terrestrial group. Coloured tree branches correspond to coloured sampling sites on the map. The smooth curve represents global sea-level fluctuations [18]. The gradual colour change over time in the schematic represents change from high to low altitude in east China.

