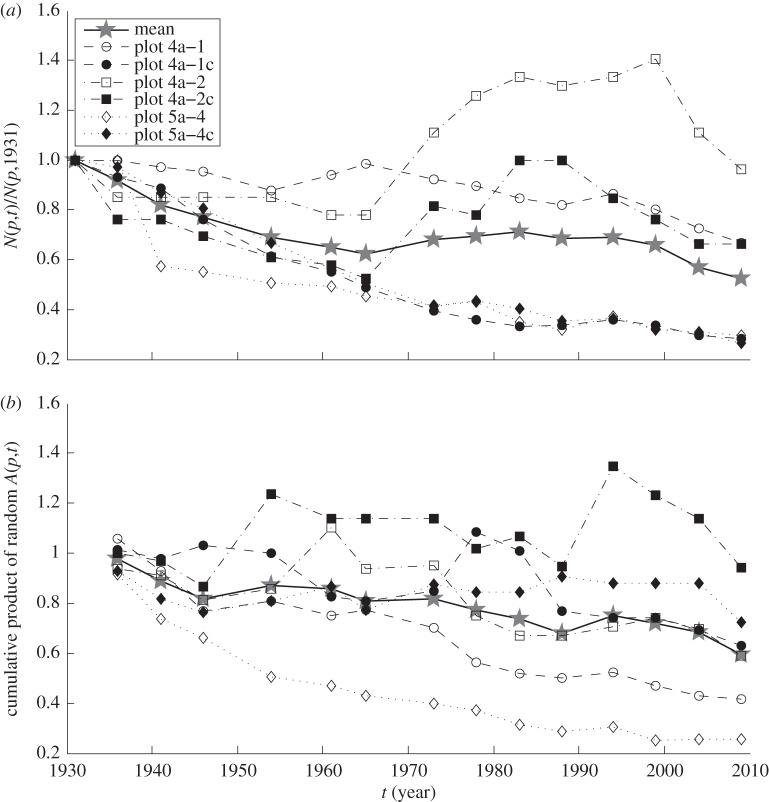
Figure 4.
Trajectories of tree population density, relative to population density in 1931 (a) of six long-term study plots in Black Rock Forest, and (b) of six illustrative simulations of the LC model. In both panels, grey stars showed the mean values at each time. (a) The observed relative tree population density N(p,t)/N(p,1931) for t = 1931, 1936, 1941, … , 2009, p = 1, … , 6. (b) The cumulative products of randomly selected values of the population growth factor A(p,t), namely A(p,t−5)A(p,t−10) ⋯ A(p,1931), for t = 1936, 1941, … , 2009, p = 1, … , 6. To form each cumulative product, each A(p,t) was sampled with replacement from the set of 84 observed values of A(p,t). The six lines in (b) illustrate six independent and identically distributed trajectories of the LC model.

