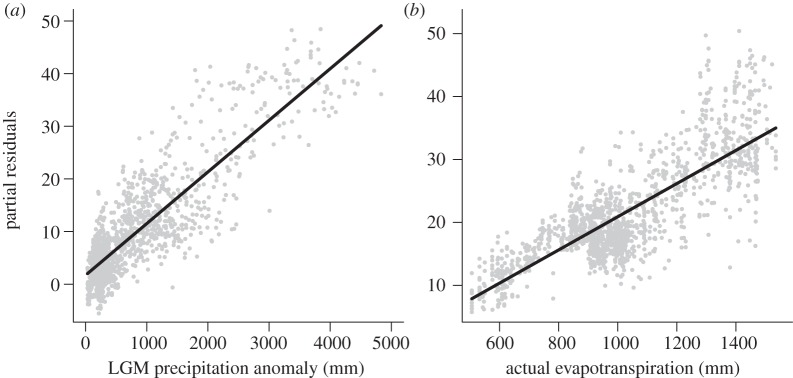
Figure 2.

Partial residual plots showing the effect of (a) LGM precipitation anomaly (PRECLGM) and (b) actual evapotranspiration (AET) on total species richness when all other predictors in the final minimum adequate model (table 2) are accounted for statistically at 0.2° (see also electronic supplementary material, figure S1). Black lines are linear fits.
