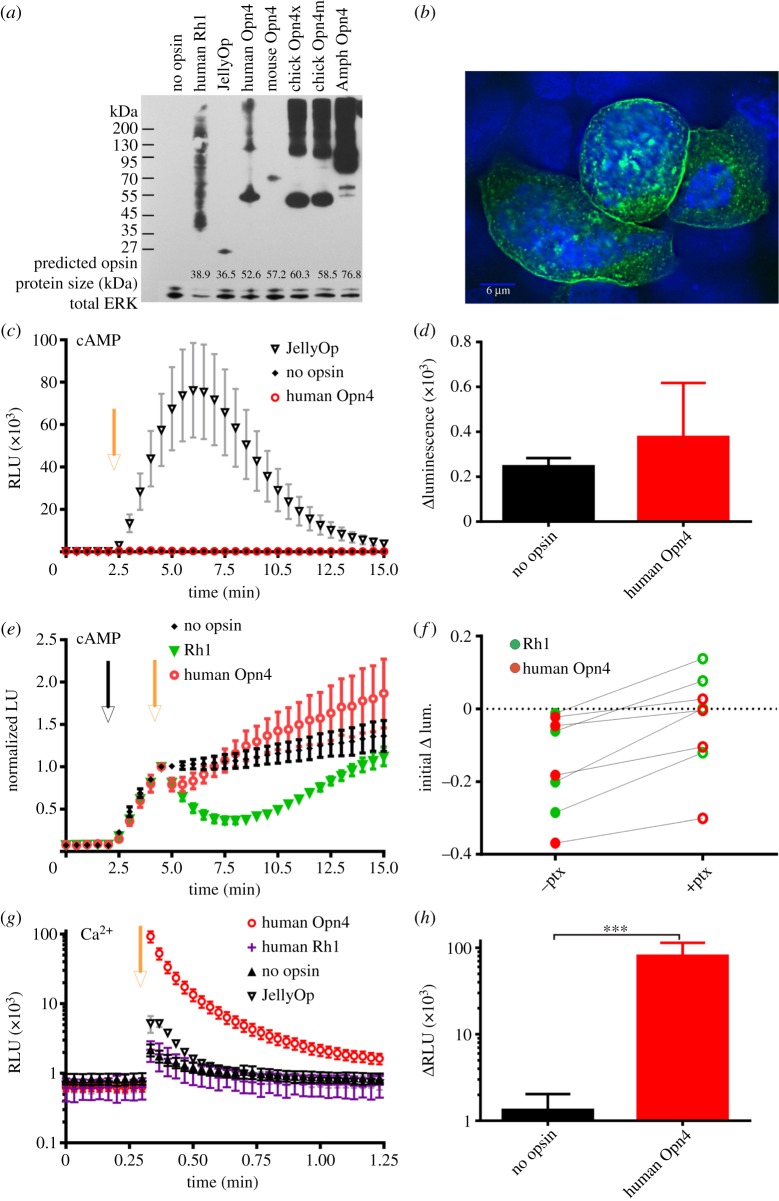
Figure 1.
Human melanopsin in HEK293 cells. (a) Western blot of opsin protein expressed and extracted from HEK293 cells. Blots were stripped and re-probed with an antibody against total ERK protein to indicate protein amount. Predicted sizes of the opsin proteins as calculated with ExPASy.com are provided at foot of blot. (b) Immunocytochemistry photomicrograph showing detection of human melanopsin expressed in HEK293 cells and labelled with a 1D4 antibody (green). Cells are also stained with DAPI, a blue nuclear stain. Melanopsin can be seen mostly localized at the cell membrane and in cytoplasmic inclusions. Scale bar = 6 µm. (c) A luminescent biosensor was used to monitor changes in cAMP production. The camera flash (yellow arrow) induced a large increase in cAMP-dependent luminescence indicative of Gs activity in cells expressing JellyOp but not those expressing human Opn4. (d) In this assay, there was no difference in the change in luminescence following light exposure in cells expressing human Opn4 and no opsin controls (t-test p > 0.05; n ≥ 3). (e) Reductions in cAMP as a result of Gi/o activity are measured by artificially raising cAMP with forskolin (black arrow) before exposing cells to light (yellow arrow). Human rod opsin (Rh1) induces a prolonged reduction in cAMP production. Luminescence was normalized to values immediately following light exposure (n ≥ 6). (f) Comparison of the reduction of forskolin-induced cAMP production 1 min following light in human melanopsin or Rh1 expressing cells treated or untreated with 100 ng ml−1 pertussis toxin (ptx). A pairwise comparison shows the light-dependent reduction is significantly reduced when treated with ptx, a Gi/o-specific inhibitor (paired t-test; **p < 0.01 both opsins). The inhibition appears greater in Rh1 expressing cells. (g) Aequorin luminescence in HEK293 cells expressing opsins as labelled. A camera flash of white light was applied (yellow arrow) and aequorin responses in a 96 well plate reader were monitored. n ≥ 4 except human rod opsin (Rh1), n = 2. (h) There was a significant difference in peak of luminescence immediately following light exposure between no opsin controls and human melanopsin (Opn4; t-test ***p < 0.001). All plots show mean ± s.e.m.

