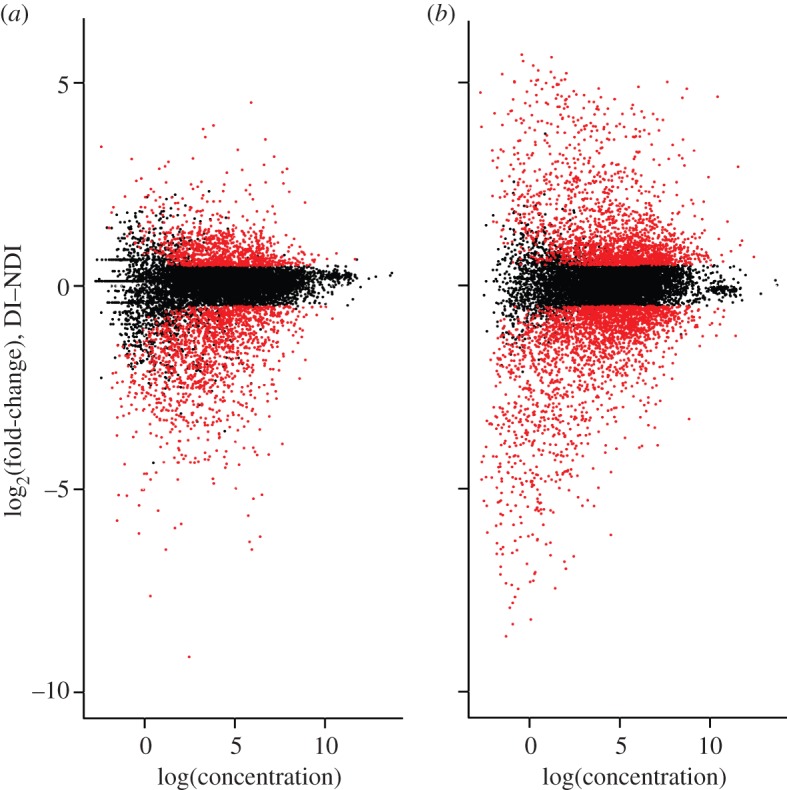
Figure 2.

Log-fold-change expression (M) versus log abundance (A) of gene expression at (a) 3 days and (b) 6 days post-oviposition. Gene expression data are TMM-normalized. Genes with higher expression under diapausing (D) conditions have positive M values, and genes with higher expression under non-diapausing (ND) conditions have negative M values. Genes that qualified as significantly differentially expressed (DE; corrected p < 0.05; absolute log2-fold change greater than 0.5) are in red.
