
Figure 3.
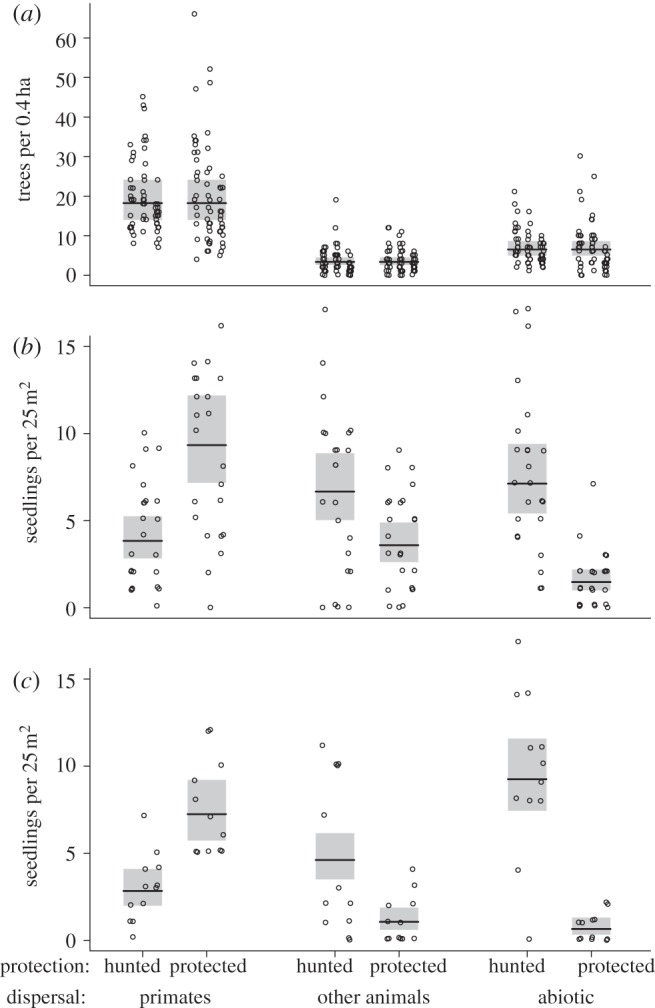
(a) The number of mature trees counted in 20 m wide and 200 m long bands along the transects. Data are shown separately for the three dispersal modes. Each circle represents one 200 m section of a transect, and different sites are separated horizontally. The horizontal lines show the estimated marginal means from the best quasi-Poisson-GLMM model. The shaded box represents the 95% CI of that mean. (b) The number of standing seedlings in 5×5 m plots. Each circle represents one plot. Horizontal line and shaded box as described in (a). (c) The number of seedlings emerging in experimental plots cleared 1 year before.