
Figure 2.
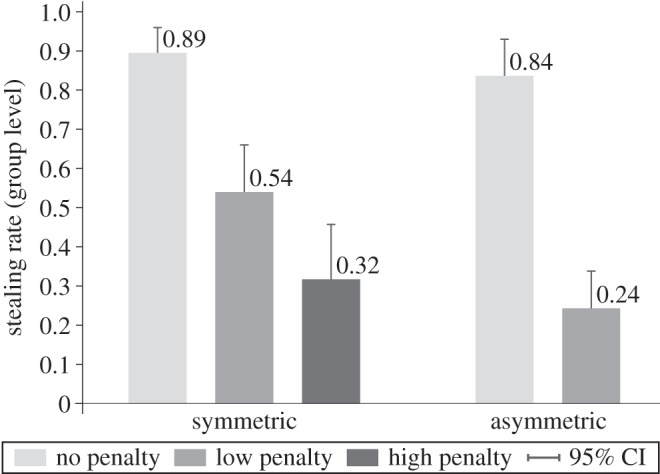
Stealing rate across experimental conditions. Without a penalty (light grey bars), the overall rate is 87% and does not differ across treatments ( , p = 0.315). With a penalty (medium and dark grey bars), the overall rate drops by 50 percentage points to 37% (H4a:
  , p < 0.001). The rate drops by 58 and 59 percentage points in the symmetric condition with a high penalty and the asymmetric condition with a low penalty, respectively—significantly more than in the symmetric condition with a low penalty, where it ‘only’ drops by 36 percentage points. The differences in differences are statistically significant (H4b:
  p = 0.018 and
  , p = 0.004, respectively).