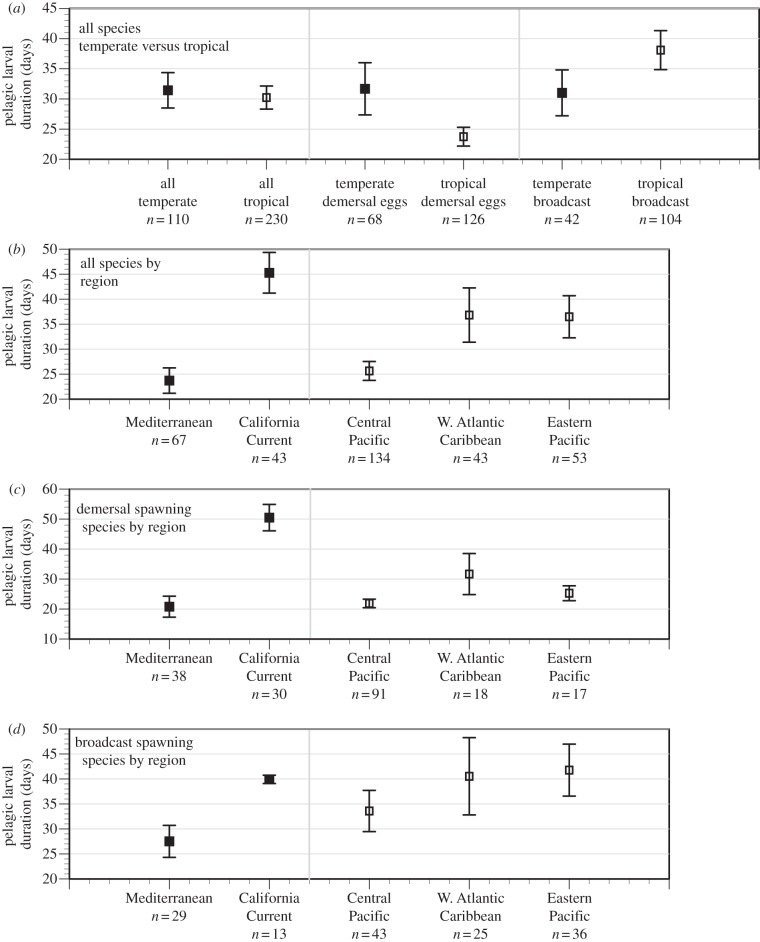
Figure 3.
Average (±95% CI) PLDs of temperate (solid squares) and tropical (open squares) reef fishes. (a) Data from all geographic locations and spawning modes combined and PLDs of demersal and broadcast spawning species plotted separately. (b) Data plotted by geographical region with spawning modes combined. (c) Data for demersal-spawning species plotted by geographical region. (d) Data for broadcast spawning species plotted by geographical region. If 95% CIs overlap, means are not significantly different, but if they do not overlap they are significantly different as confirmed by t-tests.

