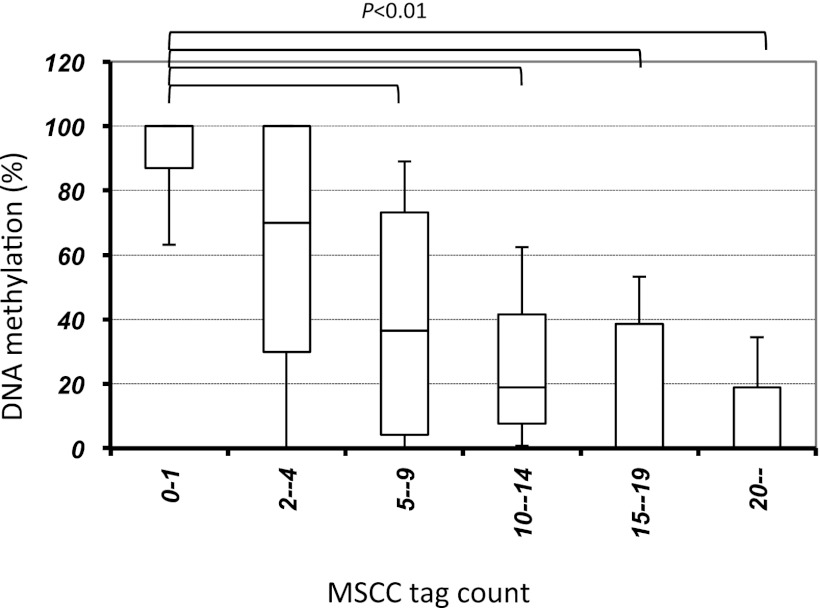
FIGURE 2.
The relationship between MSCC tag counts and bisulfite sequencing data. To validate the methylation levels determined by MSCC, we designed primers targeting 130 profiled locations in bisulfite-treated DNA and performed PCR amplification and Sanger sequencing of the PCR product. Horizontal lines represent median methylation as determined by bisulfite sequencing, boxes represent the quartiles, and whiskers mark the 5th and 95th percentiles. p < 0.01, Kruskal–Wallis H test.

