
FIGURE 4.
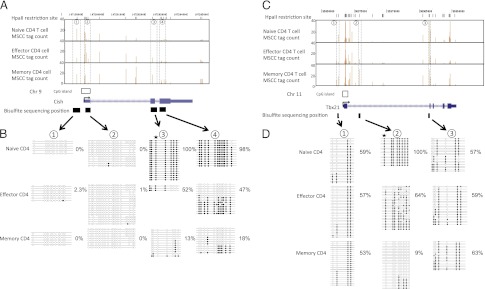
DMRs in the Cish and Tbx21 loci of naive, effector, and memory T cells. Genomic organization of the mouse Cish (A) and Tbx21 (C) loci, showing transcription start sites (arrows), single CGI (boxes), and exons (light blue). MSCC analysis of naive, effector, and memory T cells was across the 5′-end of each loci. Each vertical line (brown) represents a mean normalized tag from the MSCC analysis at the genomic location (listed on the x-axis) within the Cish and Tbx21 loci on chromosomes 9 and 11, respectively (University of California, Santa Cruz genome browser). Results of genomic bisulfite sequencing for Cish (B) and Tbx21 (D). Each row of circles represents an individual clone sequenced in the analysis after bisulfite treatment and PCR. Open circles indicate CpG sites at which no DNA methylation was detected. Filled circles indicate CpG sites that were methylated. Stars indicate the position of restriction sites detected by MSCC. Percentage values indicate the DNA methylation ratio of each region, as measured by bisulfite sequencing.