
FIGURE 7.
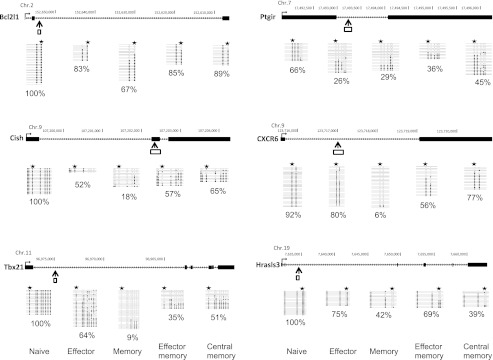
DNA methylation status of selected DMRs in subpopulations of central and effector memory CD4+ T cells. CD62L+ CCR7+ and CD62L− CCR7− CD4 T cells from BALB/c mice were isolated to represent “central memory” and “effector memory” T cells, respectively. Genomic organization of the mouse Cish, Hrasls3, Tbx21, CXCR6, Bcl2l1, and Ptgir loci, showing transcription start sites (→), exons (black box), DMRs that were detected by MSCC (↑), and bisulfite sequencing position (white box). Graphs show results of genomic bisulfite sequencing, where each row of circles represents an individual clone sequenced in the analysis after bisulfite treatment and PCR. Open circles indicate CpG sites at which no DNA methylation was detected. Filled circles indicate CpG sites that were methylated. Stars indicate the position of restriction sites detected by MSCC. Percentage values indicate the DNA methylation ratio of each region, as measured by bisulfite sequencing.