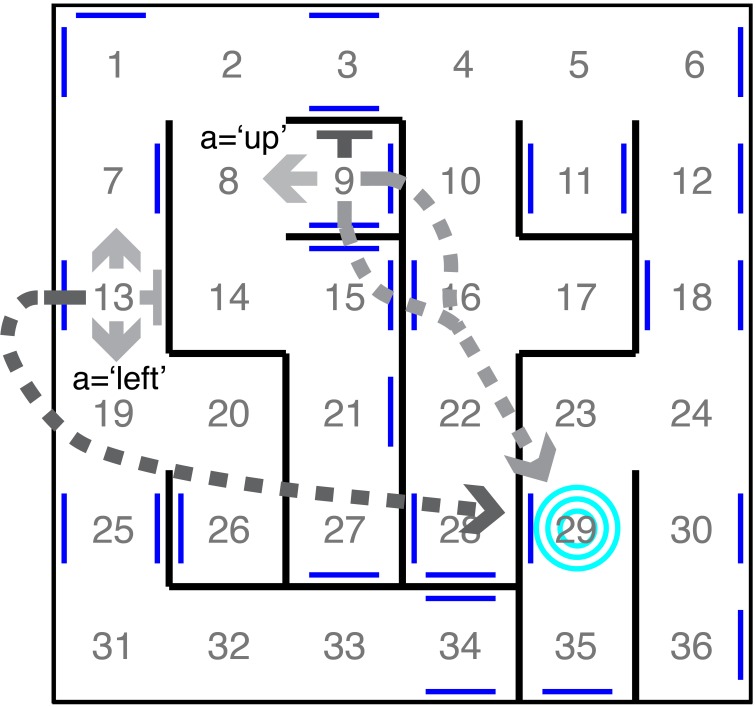
Figure 1.
Example maze. The 36 states correspond to rooms in a maze. The four actions correspond to noisy translations in the cardinal directions. Two transition distributions are depicted, each by a set of four arrows emanating from their originating states. Flat-headed arrows represent translations into walls, resulting in staying in the same room. Dashed arrows represent translation into a portal (blue lines) leading to the absorbing state (blue target). The shading of an arrow indicates the probability of the transition (darker color represents higher probability).

