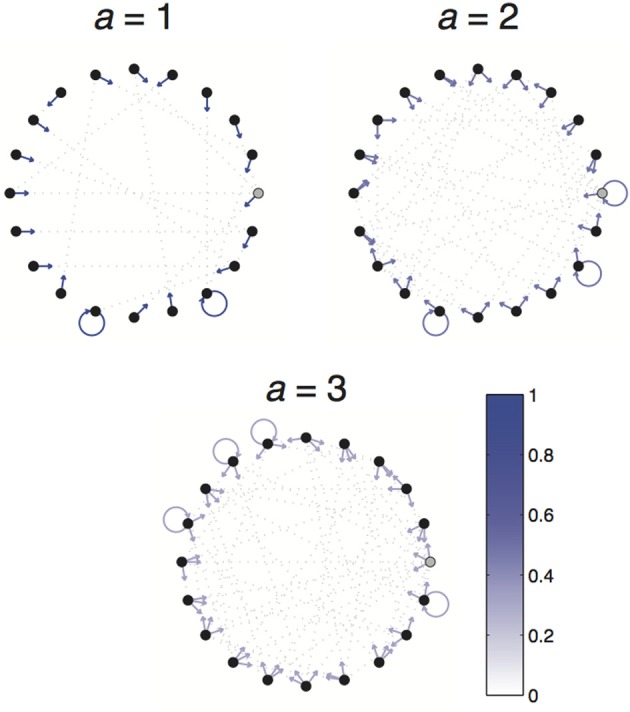
Figure A2.

Example 1-2-3 World. 1-2-3 Worlds consist of 3 actions (separately depicted) and 20 states (depicted as nodes of the graphs). The transition probabilities associated with taking a particular action are depicted as arrows pointing from the current state to each of the possible resultant states. Arrow color depicts the likelihood of each transition. The absorbing state is depicted in gray.
