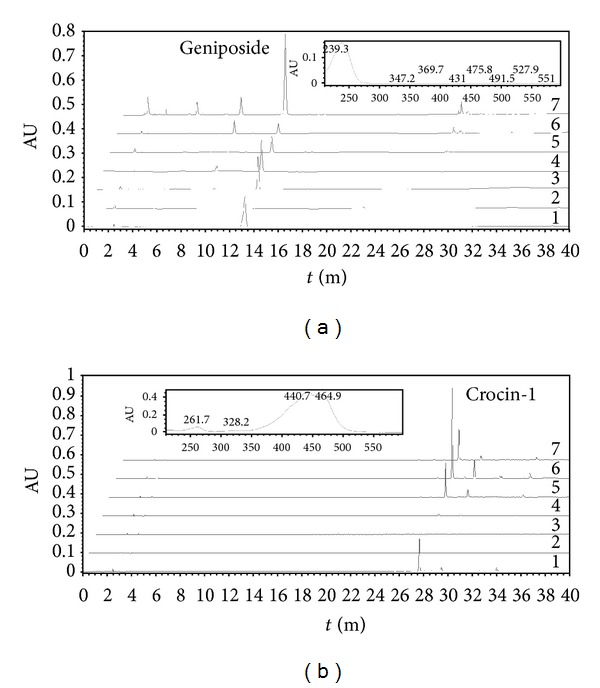
Figure 2.

HPLC profile of methanol-water extract from tissues of G. jasminoides. The main peak detected corresponds to crocin-1 or geniposide. In (a) and (b), lines: 1, crocin-1 or geniposide; 2, leaves; 3–6, fruits in St I to St IV; 7, authentic gardeniae fruit. The profiles were shifted, intended not to have these major peaks overlapping in the figure. (a) in HPLC results monitored at 238 nm, the inset shows online diode array spectrum of geniposide; (b) in HPLC results monitored at 440 nm, the inset shows online diode array spectrum of crocin-1.
