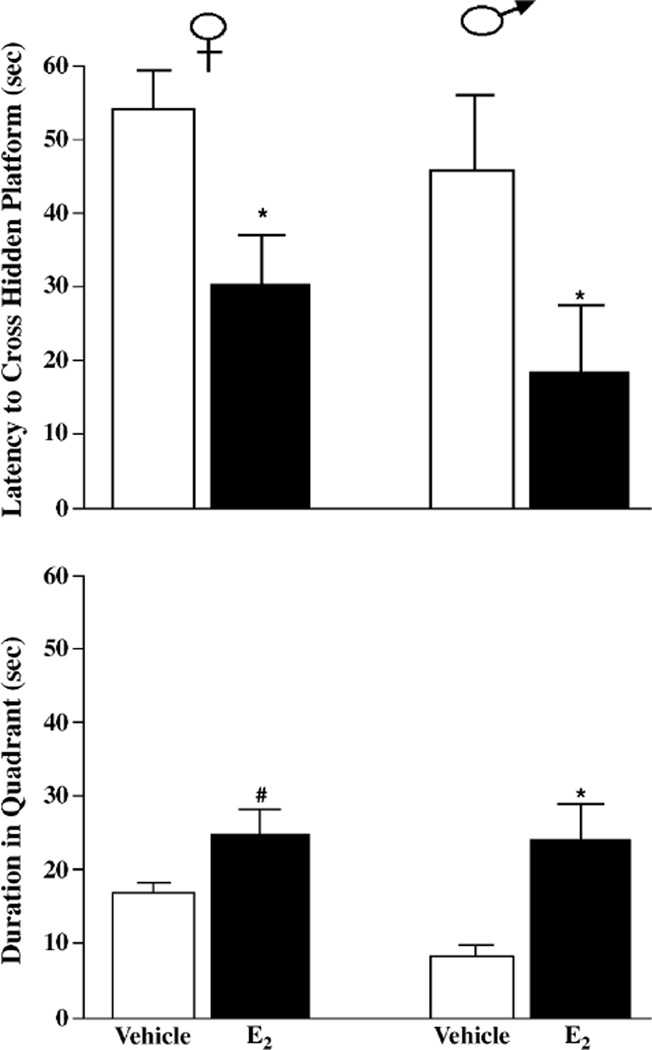
Fig. 2.
Latencies to cross (top), and duration spent swimming in (bottom), the quadrant where the platform had been during training of female (left) or male (right) mice administered post-training vehicle (n = 8 females, n = 7 males, white bars) or 10 µg E2 (n = 8 females, n = 7 males, black bars). * indicates significantly different from vehicle (P < 0.05). #indicates tendency for difference from vehicle (P, 0.10).

