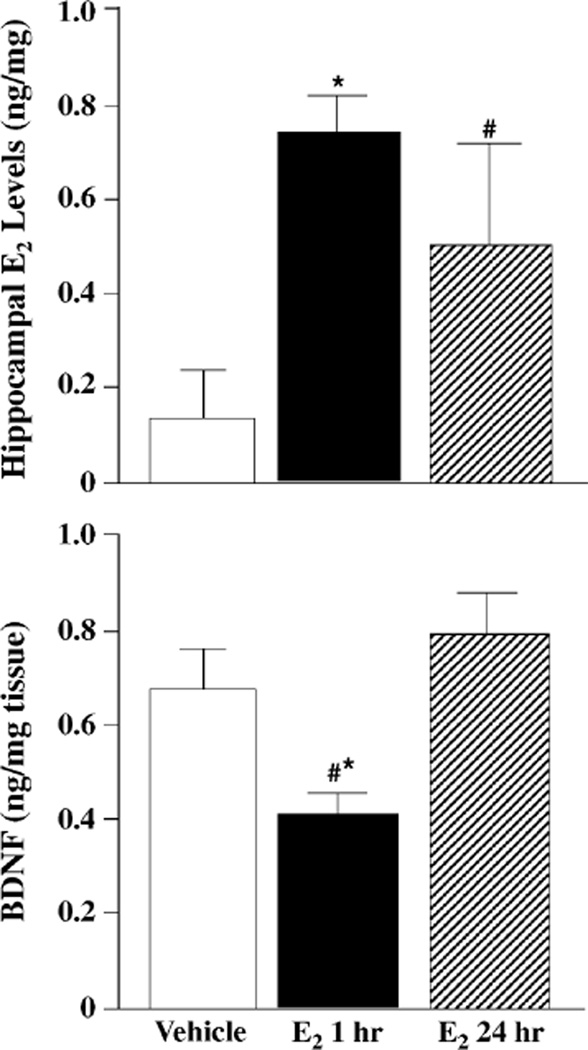
Fig. 3.
Hippocampal levels of E2 (top) or BDNF (bottom) of mice exposed to vehicle (n = 6, white bars), 1 h (n = 6, black bars), or 24 h (n = 6, striped bars) of E2. Top panel * indicates significantly different from vehicle (P < 0.05) and # indicates tendency for difference from vehicle (P < 0.10). Bottom panel * indicates significantly different from E2 24 h and # indicates tendency for difference from vehicle.

