
Figure 2.
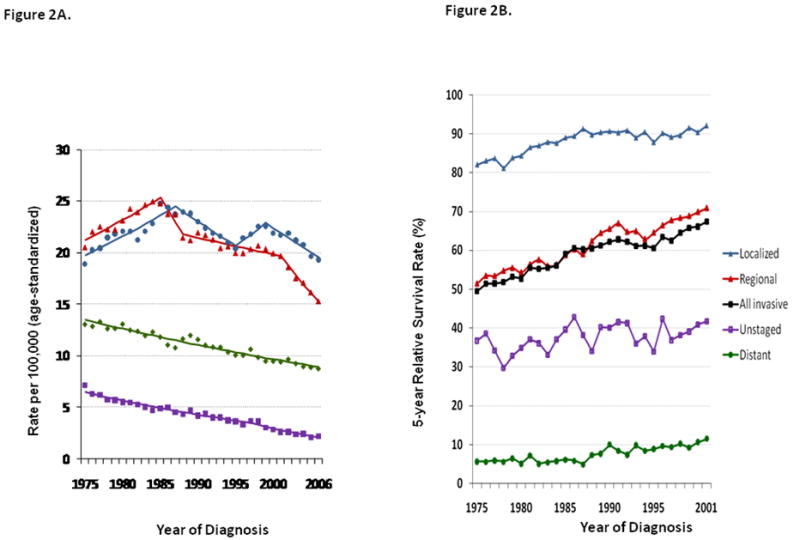
Figure 2A. Colorectal Cancer Age-Standardized Incidence Rates by Stage at Diagnosis SEER 9 Incidence, 1975–2006, All Races, Both Sexes
Figure 2B. Colorectal Cancer 5-year Relative Survival Rates by Stage at Diagnosis SEER 9 Incidence, 1975–2001, All Races, Both Sexes
Source: SEER 9 areas (San Francisco, connecticut, Detroit, Hawaii, Iowa, New Mexico, Seattle, Utah and Atlanta).
Incidence rates are age-adjusted to the 2000 US Std Population (19 age groups - Census P25-1103).
Regression lines with up to 4 Joinpoints are calculated using the Joinpoint Regression Program Version 3.3.1, April 2008, National Cancer Institute.
Stage analyses were based on SEER historic stage categories using extent of Disease codes and the Collaborative Stage Data Collection system. Relative survival was calculated with the SEER*stat software (www.seer.cancer.gov/seerstat) version 6.5.2: NCI; 2009.