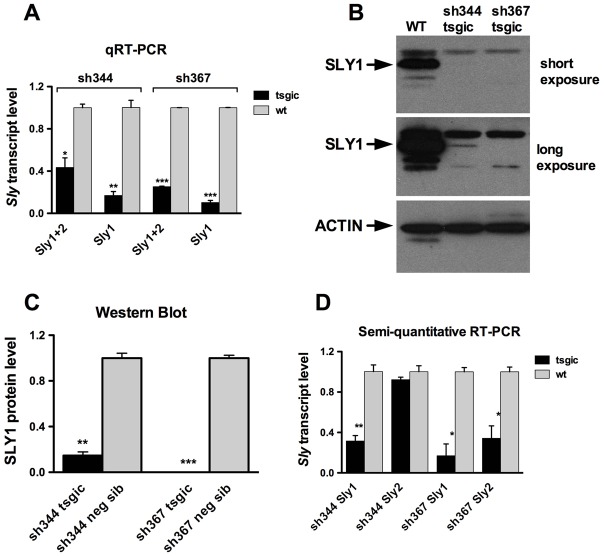
Fig. 2.
shRNA disrupts Sly expression in sh367 and sh344 differently. (A) Sly transcripts levels in shSLY transgenic mice (tsgic, n = 3 for each sh344 and sh367) and controls (neg sib, n = 2 for each sh344 and sh367) obtained by real-time RT-PCR with actin as a loading control. (B) Western blots of SLY1 protein in testis extract from shSLY transgenic mice and controls with actin as loading control. (C) Levels of SLY1 protein expression in shSLY transgenic mice (tsgic, n = 4 for sh344 and n = 3 for sh367) and controls (n = 2 for sh344 and n = 3 for sh367) quantified with ImageJ software and normalized to actin signal. (D) Sly1 and Sly2 transcript levels in shSLY transgenic mice (n = 3 for each sh344 and sh367) and controls (n = 2 for each sh344 and sh367) obtained by semi-quantitative RT-PCR, quantified with ImageJ software and normalized to actin. In A, C and D values are means ± s.e.m. Statistical significance with respect to corresponding control: *P<0.05, **P<0.01, ***P<0.001 (t-test). Similar results were obtained for mice on C57BL/6 and MF1 backgrounds. Neg sib, negative siblings. Primer sequences are shown in supplementary material Table S3.

