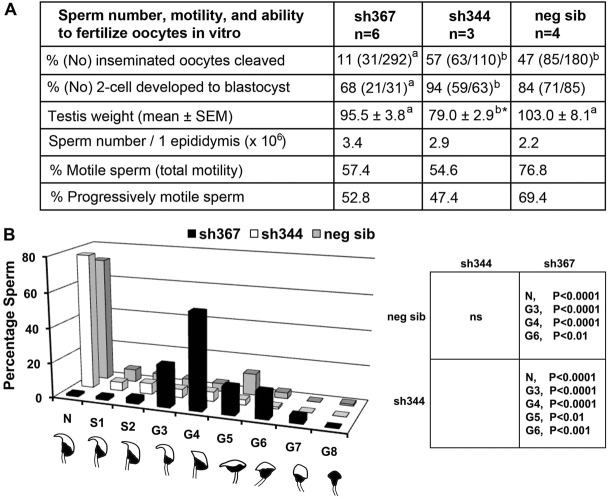
Fig. 3.
Sperm analyses in Sly-deficient mice. The analysis was performed for two transgenic lines with Sly deficiency (sh344 and sh367) and non-transgenic siblings controls (neg sib). (A) Analysis of sperm number, motility and ability to fertilize oocytes in vitro. Numbers with different superscripts within rows are statistically different (P<0.05); *Testes from only two males were weighted. (B) Sperm morphology analysis. Data shown in the y-axis are the percentage of sperm analyzed. Three hundred sperm were scored per male, with number of males n = 3, n = 3 and n = 5 for sh344, sh367, and neg sib, respectively. The x-axis represents individual categories of sperm head shapes: N, normal; S1–S2, slight defects; G3–G8, gross defects. Examples of each head shape are shown under each sperm morphology designation. The table on the right shows significant differences between the genotypes in the proportion of specific morphology defects (two-way ANOVA). ns, non statistically significant.

