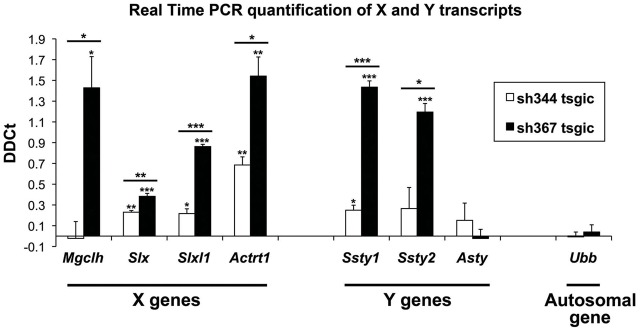
Fig. 7.

X-Y gene upregulation in Sly-deficient mice. Gene expression in testis from two Sly-deficient lines (sh344 and sh367) was analyzed by real-time PCR. Values plotted are ΔΔCt ± standard errors. The difference in PCR cycles with respect to the spermatid-specific gene Acrv1 (ΔCt), the expression of which is not regulated by Sly, for a given experimental sample was subtracted from the mean ΔCt of the reference samples (negative siblings of each transgenic line) (ΔΔCt). Three to five animals were analyzed per genotype. Asterisks indicate significant difference between sh344 and sh367 or between Sly-deficient mice and control values (t-test) with *P<0.05, **P<0.01 and ***P<0.001. Primer sequences are shown in supplementary material Table S3.
