Fig. 7.
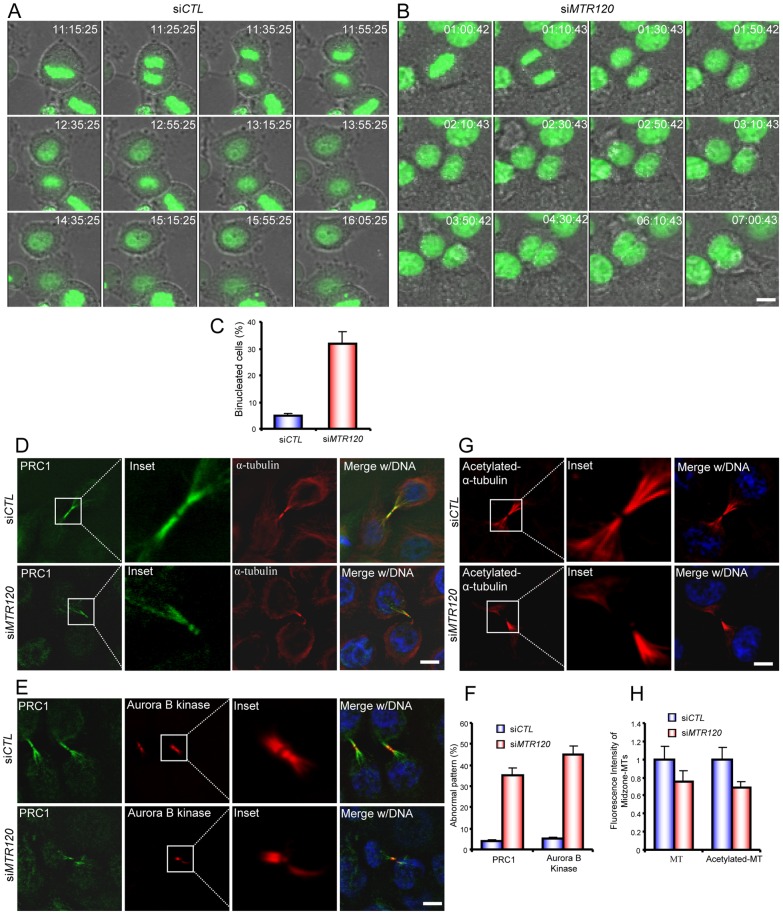
MTR120 downregulation leads to cytokinesis defects and mislocalization of spindle midzone components. (A,B) Time series of live images of HeLa cells transfected with control (A) or MTR120-specific siRNA. (B) Representative merged images of GFP-H2B and brightfield images. (C) Quantification reveals the mean percentages of bi-nucleated cells resulting from cytokinesis defects; 50 control and 60 siMTR120-treated cells were analyzed in three independent experiments. (D,E) Telophase cells were stained with anti-PRC1 and anti-α-tubulin antibodies (D) or anti-PRC1 and anti-Aurora B kinase antibodies (E) to mark the spindle midzone. The insets reveal the enlarged spindle midzone region. (F) The bar graph shows the mean percentages of telophase cells with an abnormal PRC1 or Aurora kinase B pattern. PRC1 or Aurora kinase B staining with no anti-parallel pattern was scored as ‘abnormal’; 50 cells from each indicated group were counted from three independent experiments. (G) Control or siMTR120-treated cells were fixed, and anti-acetylated α-tubulin was used to detect stabilized MTs during telophase. The insets reveal the enlarged spindle midzone region. (H) Quantification revealed the fluorescence intensities of α-tubulin or acetylated α-tubulin staining in the midzone region in control and siMTR120-treated cells; 50 cells were surveyed from three independent tests (see Materials and Methods). A statistical analysis was performed using Student's unpaired, two-tailed t-test. The fluorescence intensities of both midzone MTs and midzone acetylated MTs are significantly different for control and MTR120 knockdown cells (P<0.05). Error bars represent s.d. Scale bars: 10 µm.

