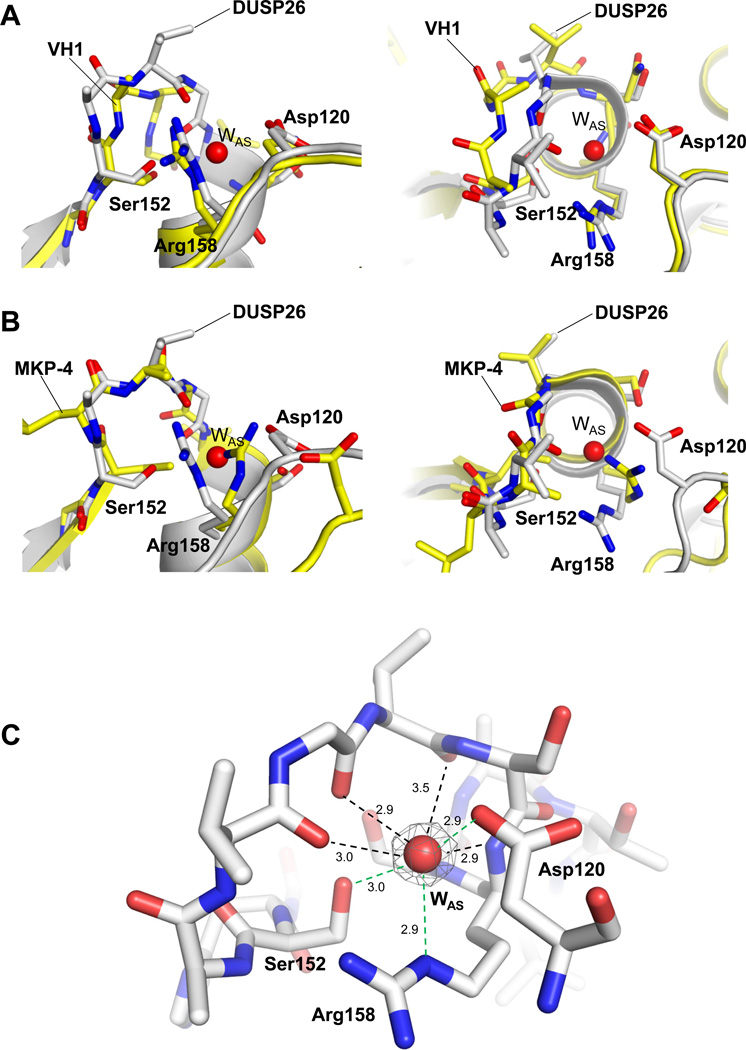
Figure 5. Conformation of DUSP26 PTP-binding loop.
Superimposition of ΔN60-C/S-DUSP26 PTP-loop with VH1 (pdb id 3CM3) (A) and MKP-4 (pdb id 3LJ8) (B), in side (left panels) and top view (right panels). In all panels, DUSP26 is colored in gray while VH1 and MKP-4 are in yellow. For clarity, only DUSP26 catalytic triad and WAS have been labeled (and the phosphate ion trapped in VH1 active site has been omitted). (C) Snapshot of ΔN60-C/S-DUSP26 WAS (red sphere) trapped inside the PTP-loop (shown as sticks). A Fo − Fc electron density map (colored in gray) contoured at 3.5 σ above background is overlaid to WAS. The density was calculated after omitting WAS from the refined model. Distances between WAS and PTP-loop main and side chain atoms are indicated by black and green dashed lines, respectively.

