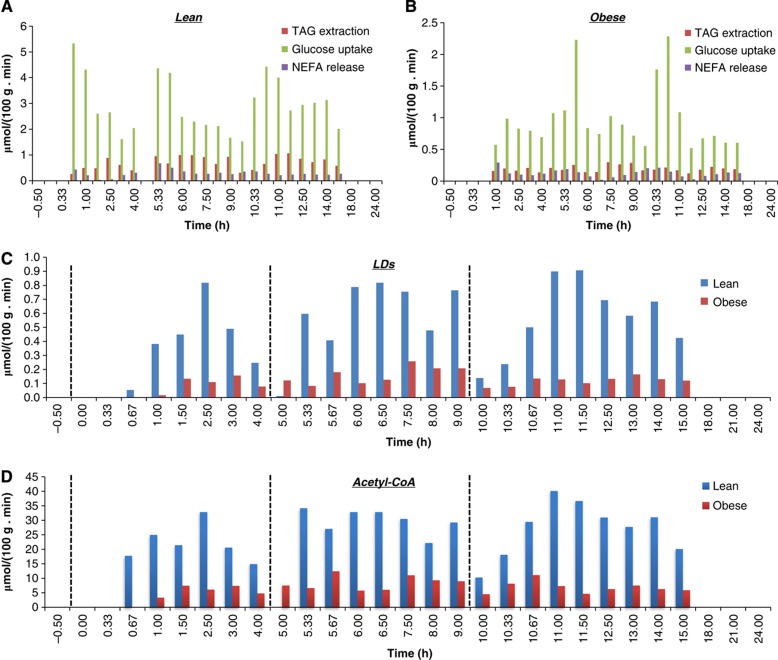
Figure 5.
Simulation results for lipid droplets and acetyl-CoA production. Formation of lipid droplets (LDs) and acetyl-CoA that is the central node in the mitochondria has been simulated and qualitative amounts were predicted through the use of iAdipocytes1809. Acetyl-CoA is central metabolite in the mitochondria and the reduced dynamics in LD levels in obese clearly results in lower fluxes through this key metabolite in obese subjects. The uptake rates for glucose and triacylglycerols (TAGs) and release rates for non-esterified fatty acids (NEFAs) in adipocytes for lean (A) and obese (B) subjects have been used as lower and upper bounds for input reactions (McQuaid et al, 2011) and the amount of LDs (C) and acetyl-CoA (D) is generated for 24 h. In addition, the NEFA concentrations in adipocytes and plasma and FA content of lipid structures are incorporated into the model during the generation of pool metabolites. The dashed lines at time=0, 5, 10 represent breakfast, lunch and dinner, respectively, for each participants of the study. iAdipocytes1809 cannot produce LDs and acetyl-CoA at some time points since adipocytes degrade the LDs at post-absorptive state to provide FAs to other tissues as energy sources. iAdipocytes1809 cannot produce LDs at time=5 in lean subject groups, whereas it can produce LDs in the obese subject groups as in clinical data.

