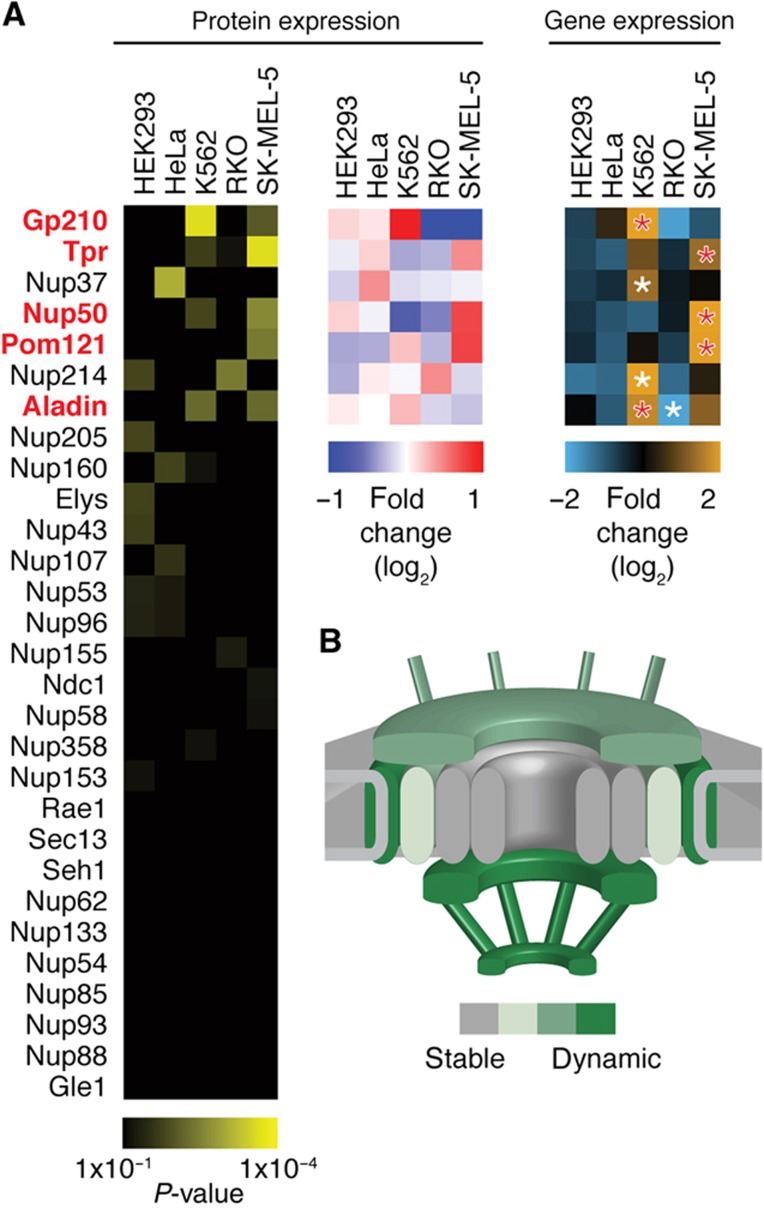
Figure 3.
NPC stoichiometry varies across human cell lines. Relative Nup protein abundances were measured by targeted proteomics in nuclei isolated from five different cell lines. (A) Three biological replicates each were analyzed using linear mixed-effect models (Supplementary Materials and Methods). In significant cases (adjusted P-value<0.01, corresponding to the top seven Nups), the mean protein fold change is shown (blue-red heat map) and compared with the mean fold change from gene expression data (light blue-orange heat map). Differential gene expression per cell line was assessed by unpaired, two-sided t-test and starred boxes indicate highly significant cases (adjusted P-value<1 × 10⁻¹⁰). For five of the seven significantly regulated Nups (highlighted in red), protein and mRNA expression data gave consistent results. (B) Schematic representation highlighting the peripheral and transmembrane localization of the dynamic NPC subunits, while the majority of all scaffold components remains unchanged. The color code is based on the fraction of dynamic subunits identified in each group. See also Supplementary Figure S5.

