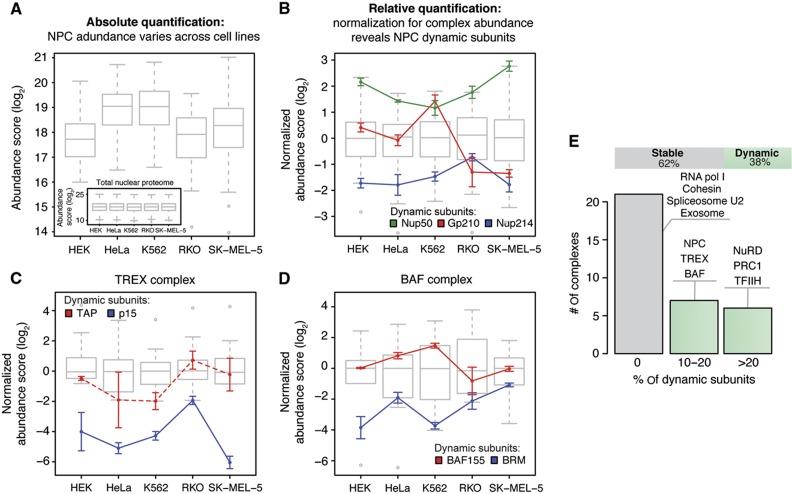
Figure 5.
Cell type-specific stoichiometries are detected for ∼38% of all investigated nuclear protein complexes. To analyze protein expression profiles in a complex-centered manner, a two-step normalization procedure was used. (A) First, the data were corrected for the variation of the total amount of nuclear protein observed in each sample using quantile normalization (inset), as commonly done for microarray data (Bolstad et al, 2003). Variable abundances of protein complexes across cell types are revealed (shown as box plot for the NPC). (B) Subsequently, the data were corrected for variable abundances of protein complexes by median subunit abundance centering. Variable stoichiometries were detected by relative subunit quantification across cell types (unpaired, two-sided t-test; significance cutoffs were set at adjusted P-value<0.01 after FDR correction and absolute log2-fold change>0.9). The NPC is shown as a test case; all the three significant dynamic subunits that were detected are in agreement with targeted proteomic measurements (Figure 3). Box plots represent the normalized distribution of NPC subunit abundances across the five cell lines; colored lines display the expression profiles of dynamic components. For each cell line, three biological replicates are grouped and displayed values are mean±standard deviation. (C, D) Same as in (B), but for selected protein complexes that displayed stoichiometric variations. In case of TREX complex (C), the profile of TAP is displayed using a dashed line, despite being below the significance threshold (adjusted P-value=0.066, log2-fold change=1.9 in RKO), since it is known to form a heterodimer with the significantly changed subunit p15 (Katahira and Yoneda, 2009). (E) Thirty-eight percent of all analyzed nuclear protein complexes displayed dynamic stoichiometric arrangements (shown as bar chart). Complexes were defined as dynamic if the expression of at least one subunit was significantly changed across the cell lines. Selected examples showing different percentages of dynamic subunits are listed. See also Supplementary Figure S6 and Supplementary Table S2.

