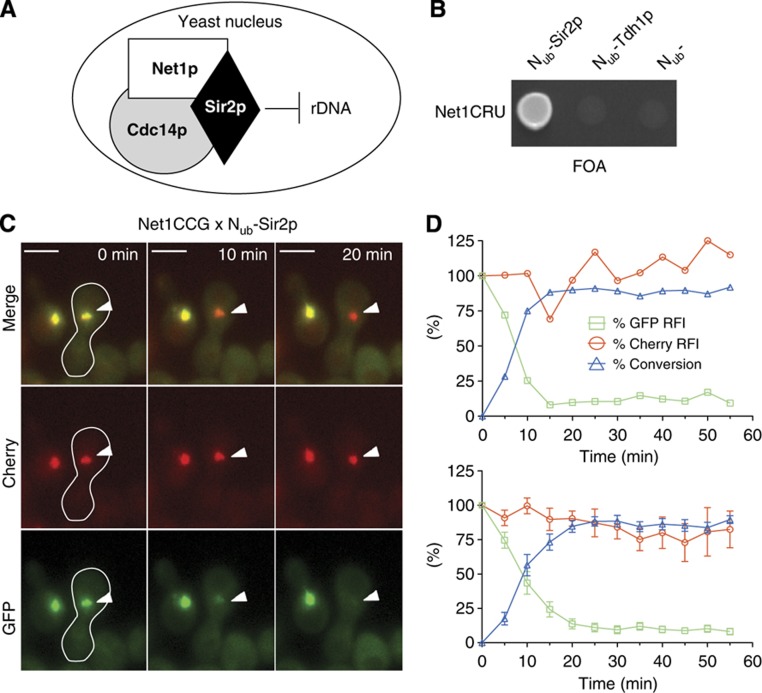
Figure 2.
SPLIFF analysis of the Net1p/Sir2p interaction. (A) Cartoon of the RENT complex. (B) Interaction between Net1p and Sir2p as measured by the Split-Ub growth assay. Cells expressing an interacting Nub fusion grow on medium containing 5-FOA. (C) Interaction between Net1p and Sir2p as measured by SPLIFF. Selected frames of the time-lapse analysis of the mating of two yeast cells expressing Net1CCG and Nub-Sir2, respectively, (white border) are shown. Nuclei of unfarmed cells belong to haploid a-cells. Note the selective loss of green fluorescence from the a-cell-originated nucleus in the diploid at 10 and 20 min. Time 0 indicates the time point shortly before cell fusion. Scale bar, 5 μm. (D) Quantitative analysis of the experiment shown in (C) (upper panel) or the averages of 6 independent experiments (lower panel). The relative fluorescence of GFP ( ), Cherry (
 ) and the calculated conversion of Net1CCG to Net1CC (
 ) are plotted against the time (error bars, standard error (s.e.)). See also Supplementary Figure 1 and Supplementary Movie 1. Source data for this figure is available on the online supplementary information page.

