Figure 3.
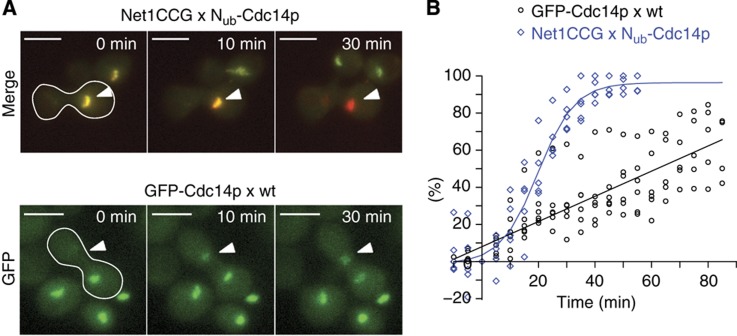
Comparison between Nub-Cdc14p-induced Net1CCG conversion and GFP-Cdc14p accumulation. (A) α-Cells expressing Nub-Cdc14p were mated with a-cells expressing Net1CCG and the conversion to Net1CC was recorded after mating (upper panel). Lower panel: α-cells expressing GFP-Cdc14p were mated with wild-type a-cells and the accumulation of the GFP signal was recorded in the a-cell-derived nucleus (white arrowhead) as fraction of total fluorescence measured shortly before cell fusion (t0). The white-framed cells indicate the diploid cells. (B) Pairwise comparison of best fits of independent experiments as shown in (A). Blue curve corresponds to conversion of Net1CCG and black curve to the accumulation of GFP-Cdc14. See also Supplementary Figure 1 and Supplementary Movie 2.

