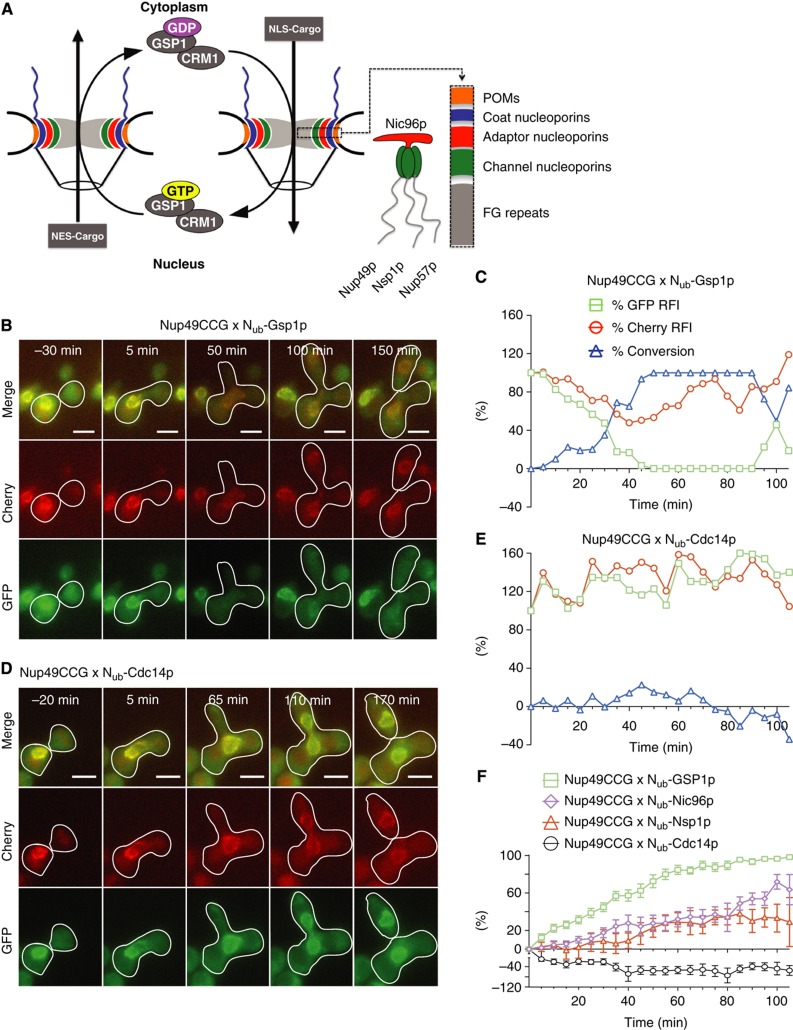
Figure 4.
Protein interactions at the nuclear pore. (A) Overview of the structure of the nuclear pore, the Nic96p sub-complex, and the nucleo-cytoplasmic traffic in yeast. (B) Selected frames of the time-lapse analysis of a cell (white frame) expressing Nup49CCG and Nub-Gsp1p after mating. The haploid cells are not framed. (C) Time-dependent relative fluorescence intensity of Cherry ( ), GFP (
 ), and the calculated fraction of converted Nup49CC (
 ) from the experiment shown in (B). Time 0 indicates the time point shortly before the fusion of the two nuclei. (D) As in (B) but showing a diploid cell expressing Nup49CCG and Nub-Cdc14p after mating. (E) Analysis as in (C) but of the experiment shown in (D). The nuclear protein Nub-Cdc14p does not interact. (F) Time-dependent change of the fractions of converted Nup49CC through interaction with Nub-Gsp1p (
 ), Nub-Nic96p (
 ), Nub-Nsp1p (
 ), and Nub-Cdc14p (
 ). The averages of n=8 independent matings (error bars, s.e.) are shown. The expressions of the Nub fusions were induced by 100 μM copper. Scale bar, 5 μm. See also Supplementary Figure 2 and Supplementary Movies 3 and 4. Source data for this figure is available on the online supplementary information page.

