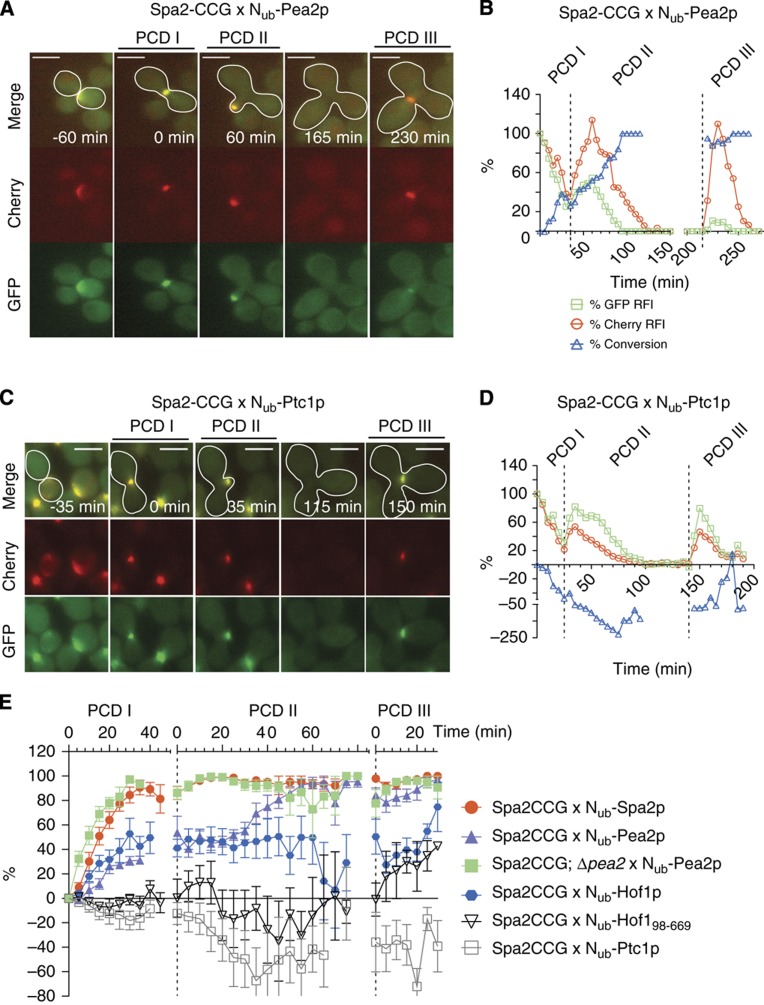
Figure 5.
SPLIFF analysis of the interactions between components of the polar cortical domain. (A) Selected frames of the time-lapse analysis of a cell (white frame) expressing Spa2CCG and Nub-Pea2p after mating. The haploid cells are not framed. PCDI indicates the stained region below the membrane of the shmoo tip, PCDII the region below the membrane of the growing bud, and PCDIII the region of cell separation. (B) Time-dependent relative fluorescence intensity (RFI) of Cherry ( ), GFP (
 ), and the calculated fraction of converted Spa2CC (
 ) of the experiment shown in (A). Time 0 indicates the time point shortly before the fusion of the cells. (C, D) As (A) and (B) but with diploid cells expressing Spa2CCG and Nub-Ptc1p after mating. The cytosolic protein Nub-Ptc1p does not interact with Spa2CCG. (E) Time-dependent change of converted Spa2CC through interaction with Nub-Spa2p (
 ), Nub-Pea2p (
 ), and Nub-Pea2p in cells lacking the native Pea2p (
 ), Nub-Hof1p (
 ), Nub-Hof198–669 (
 ), and Nub-Ptc1p (
 ). Dashed lines separate the analyses of the subsequent PCDs. The averages of n=6 independent matings (error bars, s.e.) are shown. Scale bar, 5 μm. See also Supplementary Figure 3; Supplementary Movies 5–8. Source data for this figure is available on the online supplementary information page.

