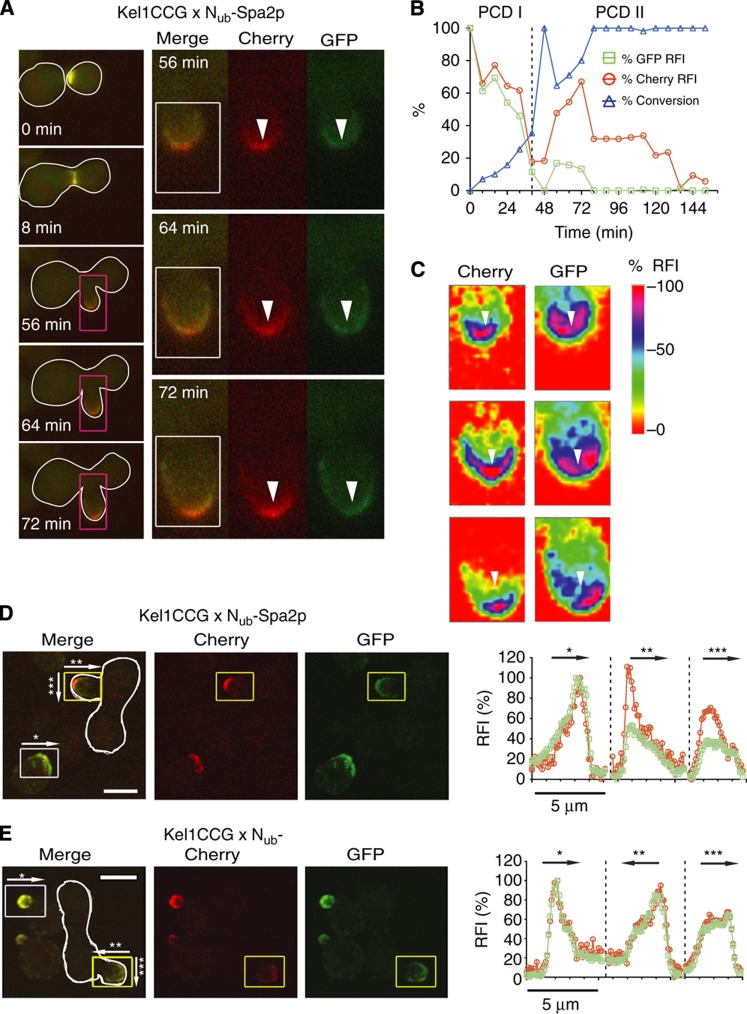
Figure 6.
Map of the cellular location of the Spa2p/Kel1p interaction. (A) Left panel: Selected frames of the time-lapse analysis of a diploid cell (white frame) expressing Kel1CCG and Nub-Spa2p after mating. The distribution of Kel1CCG and Kel1CC is shown. Right panel: Blow-ups of the purple-framed buds showing the distribution of GFP (Kel1CCG) and Cherry (Kel1CCG+Kel1CC) at the indicated times. (B) Time-dependent change of the relative fluorescence intensity (RFI) of Cherry ( ), GFP (
 ), and the calculated fraction of converted Kel1CC (
 ) in the experiment shown in (A). Time 0 indicates the time point shortly before cell fusion. (C) Colour-coded maps of the RFIs of cherry (Kel1CCG+Kel1CC) and GFP (Kel1CCG) obtained from the area within the white squares of (A), right panel. White arrows point to identical regions of the bud in the two channels and mark regions of relative depletion of GFP (Kel1CCG). (D) Left panels: 3D reconstructions of confocal images from GFP, Cherry and merged channels of yeast cells expressing Kel1CCG, or Kel1CCG and Nub-Spa2p after mating (white frame). Right panels show the profiles of the relative GFP and Cherry intensities from the yellow- (diploid) and white-framed (haploid) buds obtained by summing over all fluorescence intensities encountered orthogonal to the direction of the respective arrows. Arrow *: across the tip of the bud of haploid cells. Arrow **: from the tip to the base of the bud of diploid cells. Arrow ***: across the tip of the bud of diploid cells. (E) Analysis as in (D) but of cells expressing Kel1CCG and a Nub fusion not binding to Kel1p. Scale bar, 5 μm. Source data for this figure is available on the online supplementary information page.

