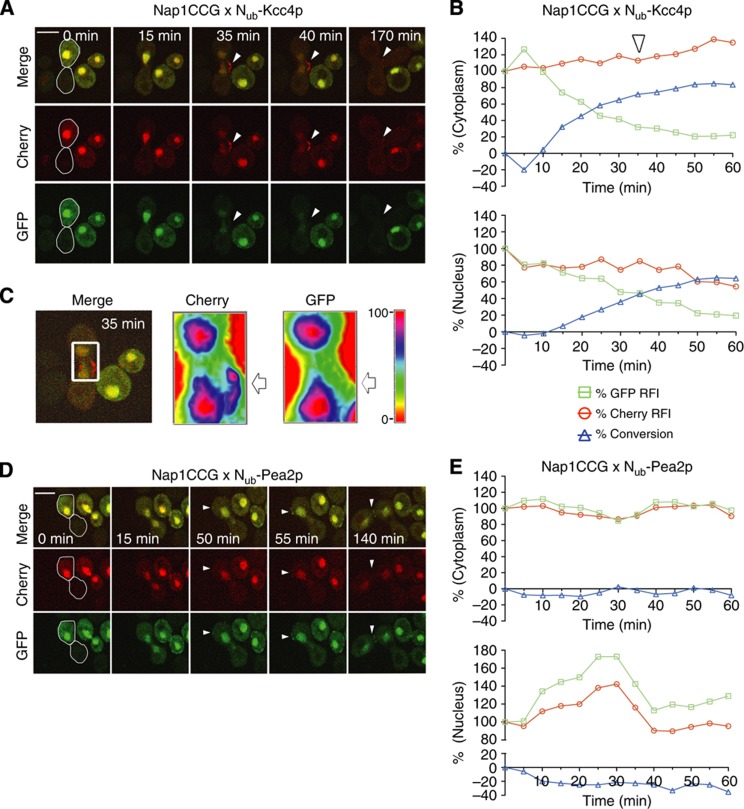
Figure 7.
Dynamic map of the Nap1p/Kcc4p interaction. (A) Selected frames of the time-lapse analysis of a diploid cell (white frame) expressing Nap1CCG and Nub-Kcc4p after mating. White arrowheads point the region of high interaction activity at the site of a newly emerging bud. (B) Time-dependent change of the relative fluorescence intensity (RFI) of Cherry ( ), and GFP (
 ), as well as the calculated fraction of converted Nap1CC (
 ) in the experiment shown in (A). The analysis distinguishes between the cytoplasmic (upper panel) and the nuclear-localized Nap1CCG (lower panel). The cytoplasmic fluorescence is defined as the difference between total cellular and nuclear fluorescence. Note that the reaction occurs faster in the cytosol than in the nucleus (see also Supplementary Figure 4). The white arrowhead indicates the time of the first appearance of the region of high interaction activity in the emerging bud. (C) Colour-coded map of the RFI of Cherry (Nap1CCG+Nap1CC) and GFP (Nap1CCG) in the white-boxed cell (left panel) in the experiment shown in (A) at 35 min. White arrows point to the emerging bud. (D, E) Analysis exactly as in (A, B) but with cells co-expressing Nap1CCG and Nub-Pea2p. Nub-Pea2p does not interact with Nap1CCG. White arrowheads point to the emerging bud that is not preferentially stained by Cherry. Expressions of the Nub fusions were induced by 100 μM copper. Scale bar, 5 μm. See also Supplementary Figure 4 and Supplementary Movie 9. Source data for this figure is available on the online supplementary information page.

