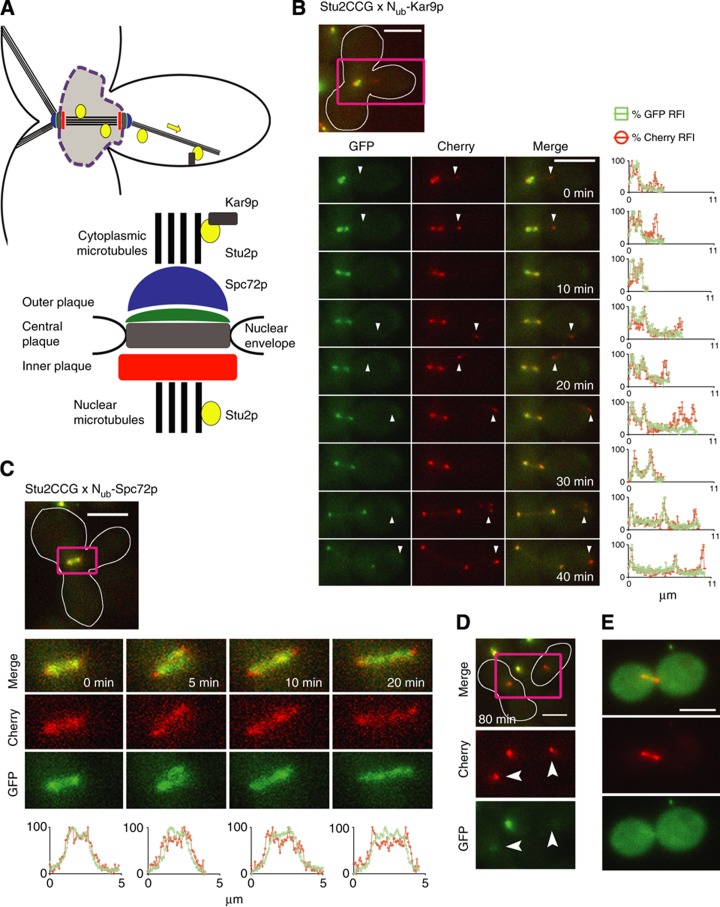
Figure 8.
Dynamic map of the interactions of Stu2p. (A) Overview of the microtubule-based structures in yeast. (B) Upper panel: Merge of GFP and Cherry channels of a Stu2CCG- and Nub-Kar9p-expressing diploid cell (white frame). Purple rectangle indicates the section shown in the frames of the time-lapse analysis of the lower left panel. Lower left panel: Selected frames of the GFP, Cherry, and the merged channels of the time-lapse analysis of a diploid cell expressing Stu2CCG and Nub-Kar9p after mating. Lower right panel: Time- and position-dependent change of the RFIs of Cherry (Stu2CCG+StuCC) ( ) and GFP (Stu2CCG) (
 ). Values are plotted along the distance of the microtubules connecting both SPBs, and the SPBs with the tip of the microtubules in the bud. The tip of the bud-directed microtubule is a region of preferred interaction between Stu2CCG and Nub-Kar9p. (C) Upper panel: Merge of GFP and Cherry channels of a Stu2CCG- and Nub-Spc72p-expressing diploid cell (white frame) after mating. The purple rectangle indicates the section shown in the frames of the time-lapse analysis of the lower panel. Lower panel: Time- and position-dependent change of the RFIs of Cherry (
 ), and GFP (
 ). Values are plotted along a line connecting the two SPBs. Both ends of the structure mark sites of preferred Stu2CCG/Spc72p interaction. (D) Same cell as in (C) but after cytokinesis has already occurred. Arrowheads indicate the SPBs of mother and daughter cell (white frame). The SPB of the mother cell retains a small amount of Stu2CCG. (E) Stu2CCG- and Nub-Spc72p-expressing diploid cells after cultivation for several generations. Scale bar, 5 μm. See also Supplementary Movie 10.

