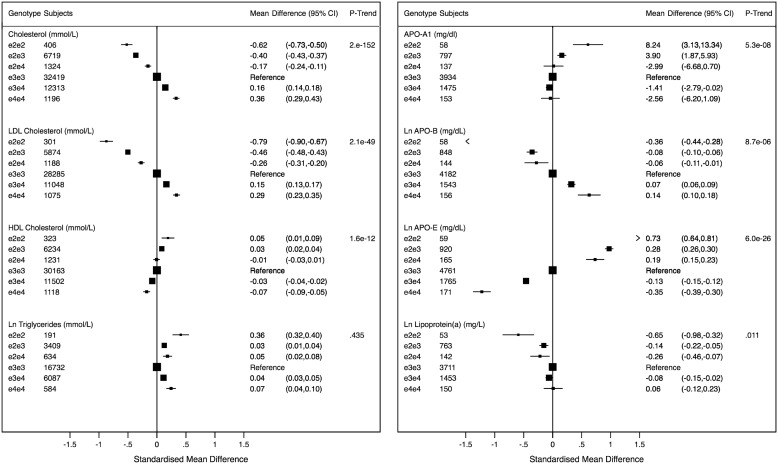
Figure 2.
APOE genotypes and lipid and apolipoprotein traits. The graphs are displayed in standardized scale to allow comparability and show standardized mean differences of biomarker levels with APOE genotypes with ε3/ε3 as reference. The values (on the right) correspond to absolute weighted mean difference. Black boxes indicate estimates proportional to counts and horizontal lines represent 95% CI. Ln, natural log transformed

