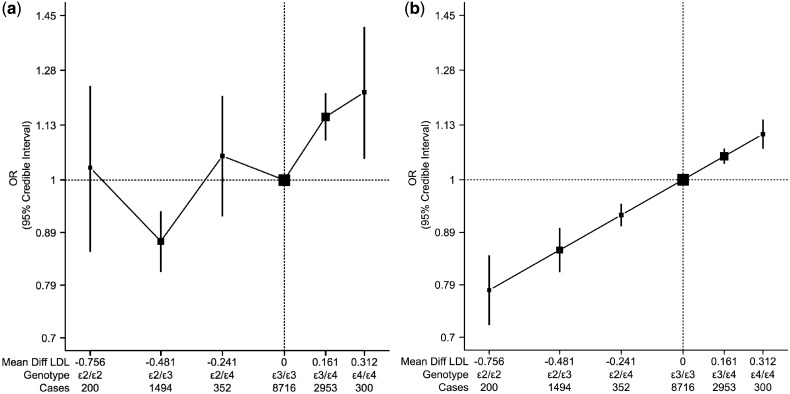
Figure 4.
Association of APOE genotypes with ischaemic stroke in all ethnicities with (a) ischaemic stroke, (b) ischaemic stroke (trend analysis). Black boxes indicate summary estimates with their size proportional to weight. The x-axis is plotted in the log-scale with distance between APOE genotypes equal to mean difference of LDL-C in mmol/l. For (b), the effect estimate of trend analysis indicates an OR of 1.39 (95% CrI: 1.25, 1.54) per 1 mmol/l increase in LDL-C

