
Fig. 3.
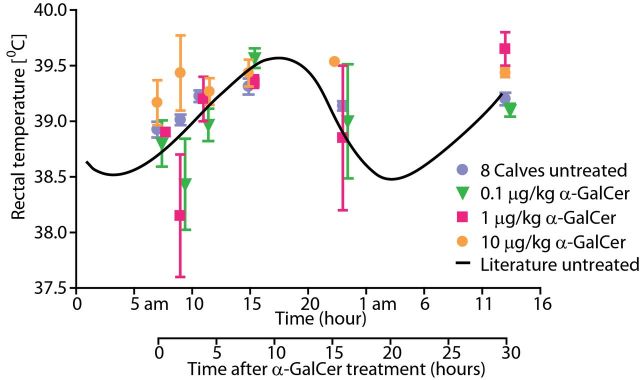
Body temperature of cattle treated intravenously with α-GalCer. The body temperature of calves treated with 0.1 (n = 3), 1 (n = 2) and 10 µg kg–1 (n = 3) α-GalCer was measured at the indicated time points after treatment. The circadian rhythm of the body temperature of healthy calves, as predicted from literature, is shown as a black line. One day before α-GalCer treatment, the body temperature of the calves was measured at the same hour as the post-α-GalCer treatment time points (in blue: “8 Calves untreated”).