
Figure 2.
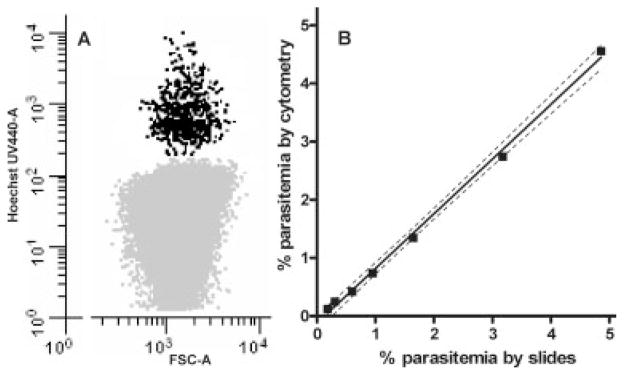
Comparison of different methods for determining parasitemia. Figure 2A is the dot plot from an unsynchronized culture with a 1% parasitemia stained with 4 μM HO which shows regular intervals of DNA positive cells possibly because of the different number of nuclei within the erythrocyte. Serial dilutions of a Pf culture were performed and the percent parasitemia was determined using two methods. First, LM using standard thin smears and Giemsa staining techniques were used to count the number of infected and uninfected RBC (>2,000) for each dilution to determine parasitemia. These results were compared with the percent parasitemia determined by staining cultures with Hoechst 33342 and counting 104 DNA positive erythrocytes by flow cytometry (Fig. 2B). All dilutions were tested in triplicate for both methods and the 95% confidence bands (dashed lines) demonstrate the consistency with which flow cytometry was comparable to the classic LM methods for identifying and counting pRBC.