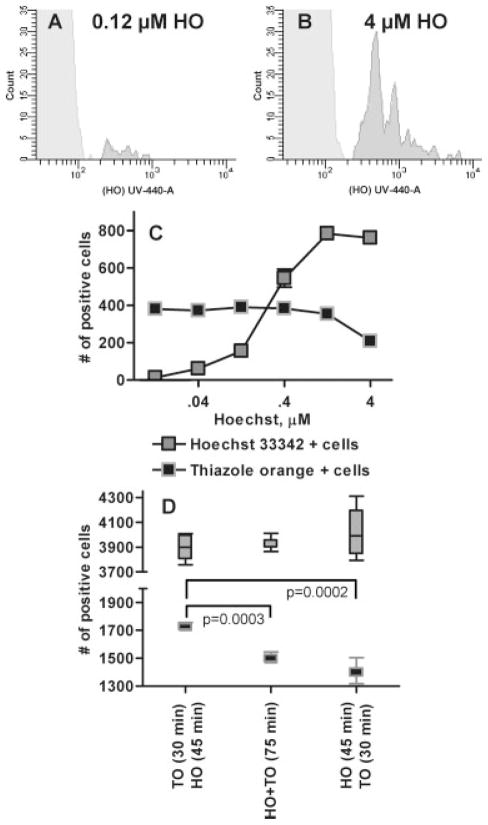
Figure 3.
Dose response and order of treatment of Plasmodium falciparum cultures with Hoechst 33342 and thiazole orange. When the concentration of HO used to stain Pf cultures is too low (Fig. 3A, 0.12 μM) many pRBC go undetected when compared with an optimized dose (Fig. 3B, 4 μM); parasitemia at both HO concentrations was 0.76%. A Pf culture was exposed to varying levels of HO from 0.012 μM to 4 μM (Fig. 3C) to determine the appropriate dose of the stain to use with Pf. Each dilution of the HO staining was repeated three times and the mean and standard error bars are shown. Because the RNA stain TO also has some ability to bind DNA the highest dose of HO (4 μM) was utilized in subsequent experiments. This dose allows for the exclusion of TO from binding to DNA showing a more accurate representation of DNA and RNA content of the various cell populations. Staining of a separate malaria culture was performed to determine how the order of stain addition affects the ability to determine the parasitemia and life cycle stages of the parasites (Fig. 3D). The whiskers indicate the entire range of the six replicate tests of each staining method with the mean and interquartile range indicated by the box.

