
Figure 5.
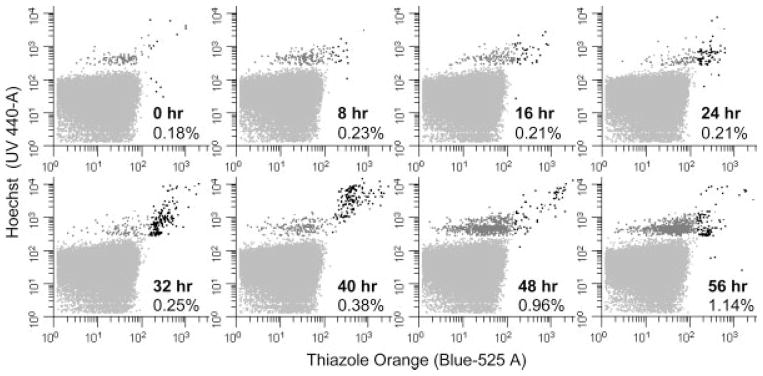
Parasite growth over time. Pf cultures were highly synchronized with sorbitol treatment leaving only uninfected erythrocytes and erythrocytes infected with rings stage parasites. This treated mixture was grown for 56 h and samples were taken every 8 h. Samples were optimally stained with HO and TO and counted by flow cytometry until 1000 DNA positive cells were observed. The overall percent parasitemia is shown in the lower right quadrant of each graph. Dot plots are colored as described in Figure 1. As the cells progress through their life cycle and express more RNA the cells progress from the upper left to the upper right quadrant. RNA levels steadily increases after 6 h (61) followed by DNA synthesis between 28–38 h (66). The anticipated sharp increase in parasitemia was detected between 40 and 48 h as the advanced stages lyse and merozoites infect naïve erythrocytes (48).