Fig. 3.
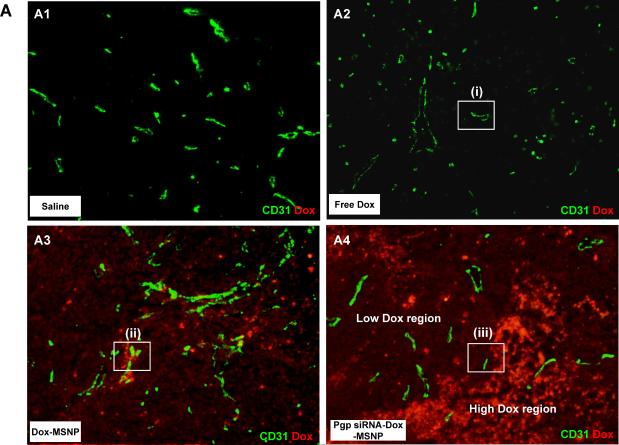
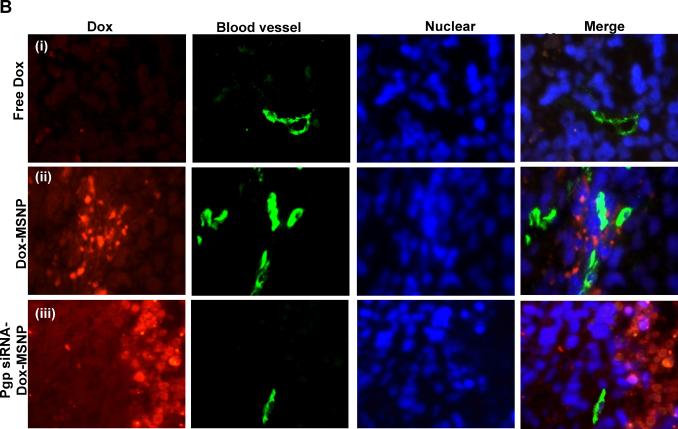
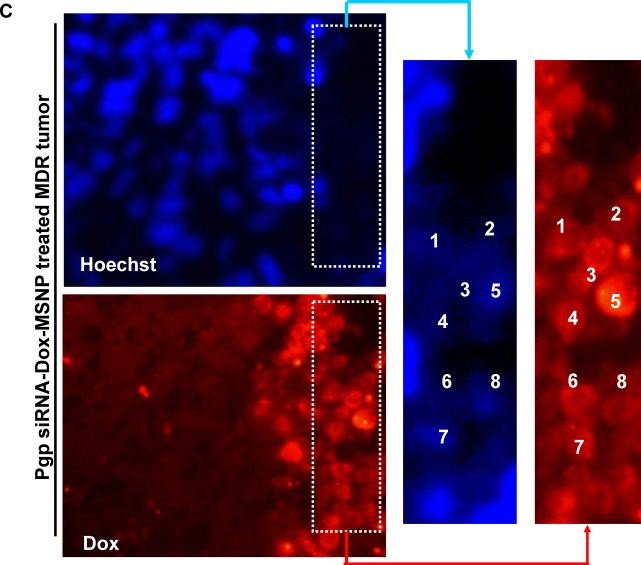
Analysis of intratumoral Dox distribution in the various treatment groups. (A) Dual color fluorescence to show the tumor localization of Dox in relation to the tumor blood vessels, stained for CD31. Part of the tumor tissue from the saline (A1), free Dox (A2), Dox-MSNP (A3), and Pgp siRNA-Dox-MSNP (A4) groups were frozen and embedded. The sections were incubated with anti-CD31 primary antibody and visualized by a FITC-conjugated secondary antibody. Dox fluorescence (red) was also assessed on the same slide view and merged images were prepared to show drug distribution in relation to the blood vessels. Slides were visualized under a fluorescence microscope at 100× (Zeiss, Germany). (B) Higher magnification images of regions “i”, “ii”, and “iii” (representing the groups shown in Fig. 3A) were obtained after Hoechst staining to demonstrate the nuclear localization in relation to Dox fluorescence in the tumor. (C) Demonstration of co-localization of faint Hoechst-stained with Dox-stained nuclei in the Pgp siRNA-Dox-MSNP treated MDR tumor in Fig. 3B-iii. Due to the cytotoxic effects of Dox and the accompanying nuclear damage, it was not always possible to observe Hoechst staining at the resolution shown in Fig. 3B-iii (far right panel). However, image analysis at a higher magnification, demonstrated that it is possible to demonstrate co-localization of faint Hoechst-stained with Dox-stained nuclei.


