Fig. 5.
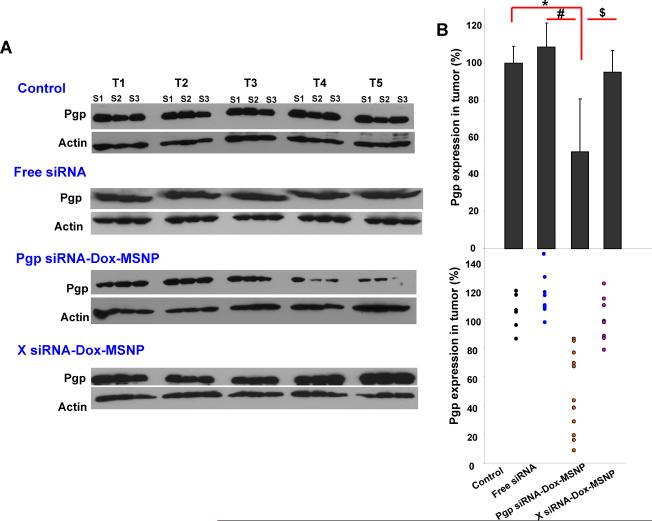
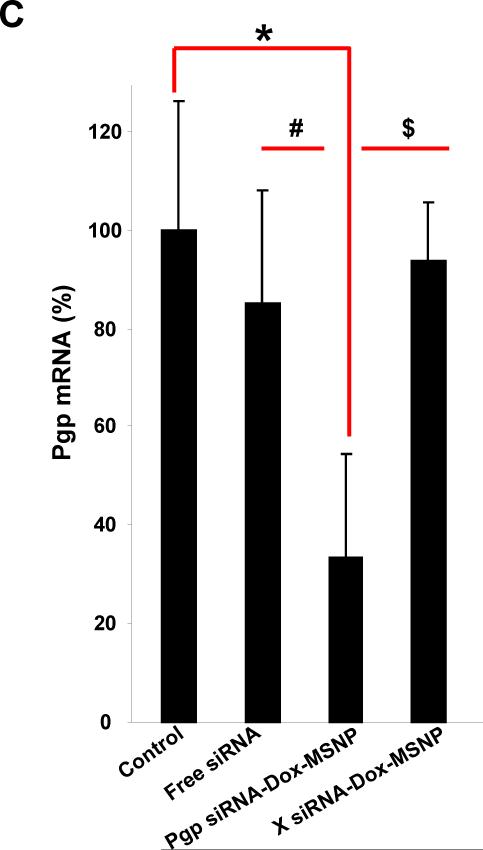
Assessment of Pgp knockdown in the tumors using western blotting and qPCR. (A) Pgp expression was studied in the different treatment groups using an IHC approach. Randomly selected biopsies taken from three sites in each tumor were used for the analysis (labeled as “S1→S3”). (B) Relative Pgp expression was calculated according to the signal intensities of the protein bands. The data were expressed as a scatter diagram to confirm a significant and heterogeneous knockdown effect in the tumor. (C) At mRNA level, three randomly selected biopsies per tumor were used for qPCR analysis that was used to confirm the Pgp knockdown effect in the different groups. *, p<0.05, compared to saline; #, p<0.05, compared to free Pgp siRNA; $, p<0.05, compared to Dox-laden MSNP with scramble (X) siRNA.


