
Figure 4.
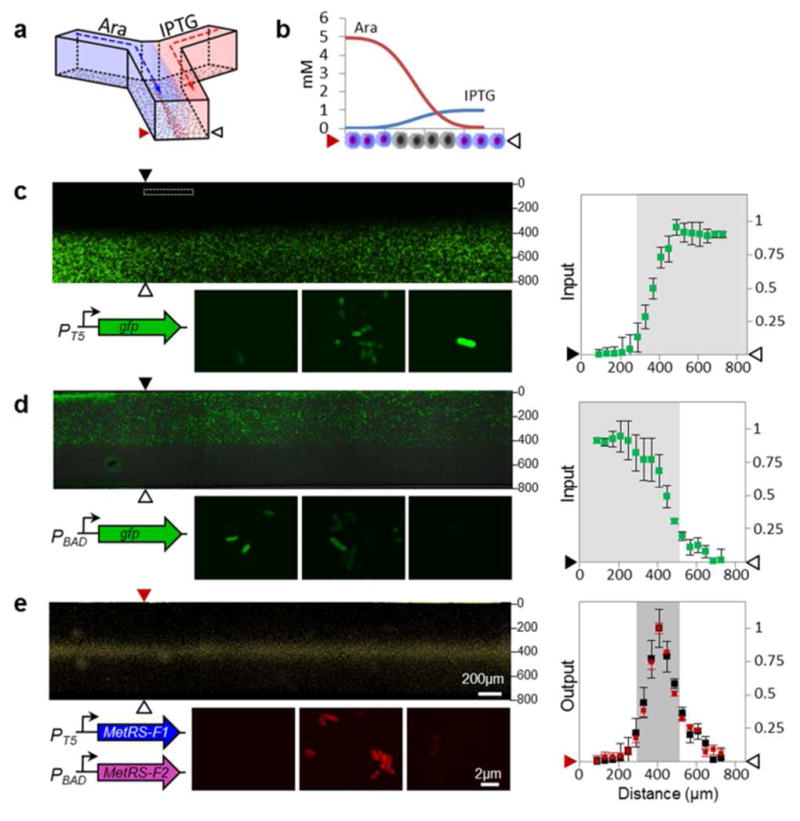
Spatial control of protein labeling. (a) A laminar flow microfluidic channel was used to expose surface-immobilized cells to gradients of arabinose and IPTG. In this device, the AND gate should be activated only in the center of the channel, where cells are exposed to both IPTG and arabinose. (b) Modeling of inducer diffusion was used to determine cross-channel concentration profiles of arabinose and IPTG at the locations shown by the arrows in (c, d, and e). Schematic shows that cells in the middle of the channel should incorporate Anl (gray); those on the periphery should not be labeled (purple). (c) Fluorescence image of the microfluidic channel (top) seeded with cells expressing GFP under IPTG control, and images of individual cells (bottom) that were incubated with varying combinations of inducers (left to right; 5 mM arabinose, 1 mM arabinose plus 0.1 mM IPTG, and 1 mM IPTG). GFP fluorescence was quantified as a function of distance from the wall of the channel at positions indicted by the arrows, and is plotted to the right. Fluorescence values were normalized by setting the maximum fluorescence to 1. (d) Fluorescence detection of arabinose-regulated GFP expression under conditions identical to (c); the corresponding normalized fluorescence values are plotted to the right. (e) Detection of Anl incorporation by labeling with TAMRA-alkyne dye. Conditions are identical to those used for (c). The plot to the right shows the TAMRA fluorescence intensity (red) as a function of distance from the wall of the channel. TAMRA fluorescence values represent the experimental output of the AND gate, and were normalized by setting the maximum fluorescence to 1. Black dots represent the products of the GFP fluorescence signals from plots in (c) and (d), which were point-wise multiplied to provide a measure of the predicted output of the AND gate. The products were normalized by setting the maximum signal to 1 in order to allow direct comparison to the TAMRA fluorescence values.