
Figure 2.
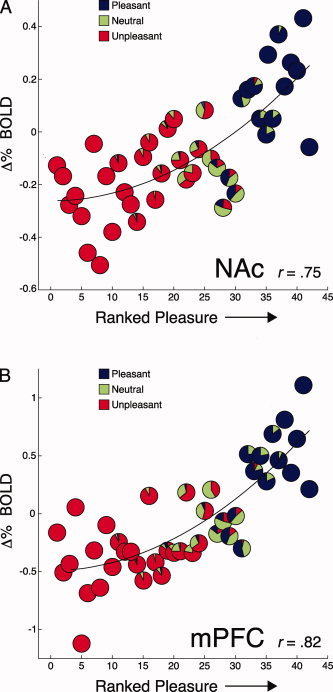
Pleasure ratings correlate with mesolimbic BOLD activity during imagery. Scenes were rank ordered by each participant's pleasure ratings and plotted against the mean signal change in NAc and mPFC at each rank. Pie charts depict the proportion of the a priori selected pleasant, neutral, and unpleasant texts at each rank [based on ANET standardized ratings; Bradley and Lang, 2007].