
Figure 3.
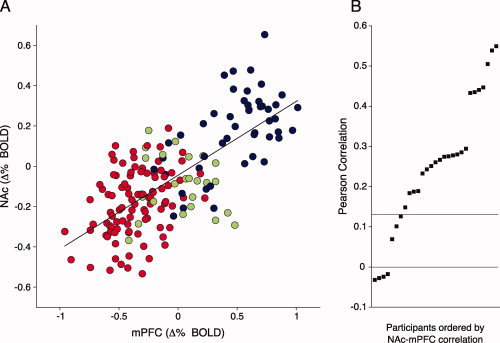
Functional connectivity of NAc and mPFC during imagery. The mean BOLD signal change during imagery in each region, averaged over participants for each of the four time points following text presentation for pleasant (blue), neutral (green), or unpleasant (red) scenes (A). The adjacent panel (B) shows the ordered distribution of the correlation between NAc and mPFC activity for each participant during imagery (r > 0.16. is significant; 0 < r < 0.16 is not significant, and r < 0 are in the unpredicted direction). [Color figure can be viewed in the online issue, which is available at wileyonlinelibrary.com.]